Scream of consciousness, live-blogged development notes. No longer updated.
The devlog is now "news"🔗
I've moved the devlog to a new location - news.
why🔗
The devlog is getting huge, and it's a bit to chaotic. I'll now be live-blogging feature development in specific articles, like I did for Light Tiling, Live.
All other blurbs are news, so they can live on the news page. I'm just trying to stay organized as this project grows.
But - this stuff will stay here for posterity.
Sun 21 September, 2025🔗
I've done a rework of the API, greatly improved the documentation and created a user's manual full of examples.
User's manual🔗
The manual covers the basics, but lacks lighting examples. Obviously it's a work in progress. I'll be making sure that it's complete after getting it online. Even in its incomplete state, it has lots of workable, tested examples in it, and I hope it helps folks get up and running.
Documentation updates🔗
There's a ton more documentation coverage. I did a big audit of the current documentation and added more where needed as well as revamped the existing docs.
The latest docs are now hosted here at /docs, due to the fact that Renderling
depends on a not yet released version of spirv-std, which the Rust-GPU group is still
working on releasing.
API changes🔗
I've removed the crabslab::Id and craballoc::Hybrid* types from the public API.
I figured that it shouldn't be necessary for users to understand anything about slabs and
descriptors.
Now all the various resources (Primitive, Material, Vertices etc) adhere to a builder
pattern for configuration and updates.
Skybox is now separate from Ibl.
Up until this point, if you wanted to render a skybox, that skybox would also perform
image based lighting automatically.
I decided to decouple these now, as there are valid situations where you may not want
IBL, but do want a skybox.
Sun 31 August, 2025🔗
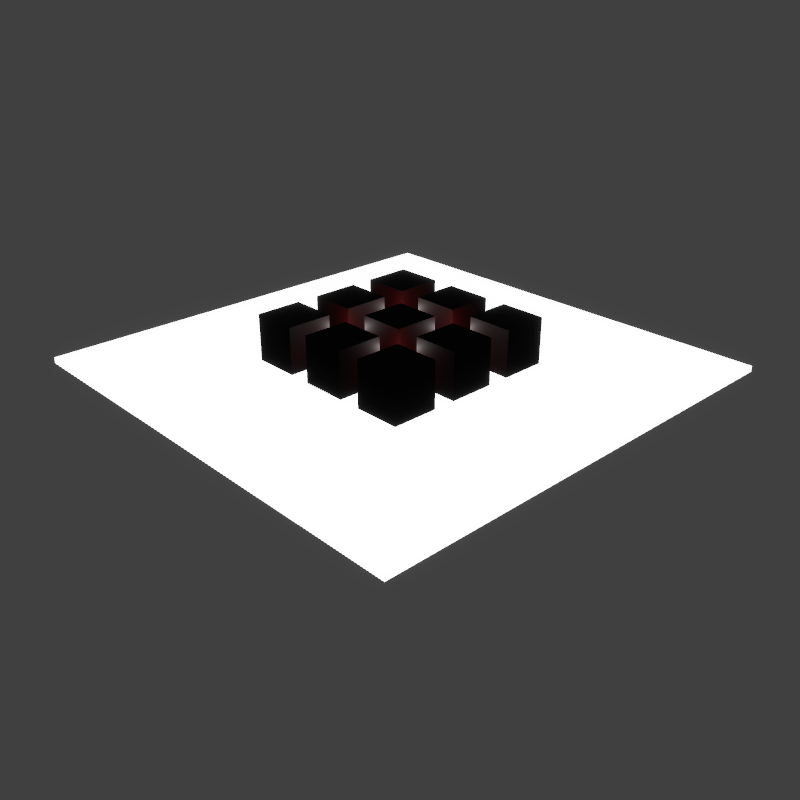
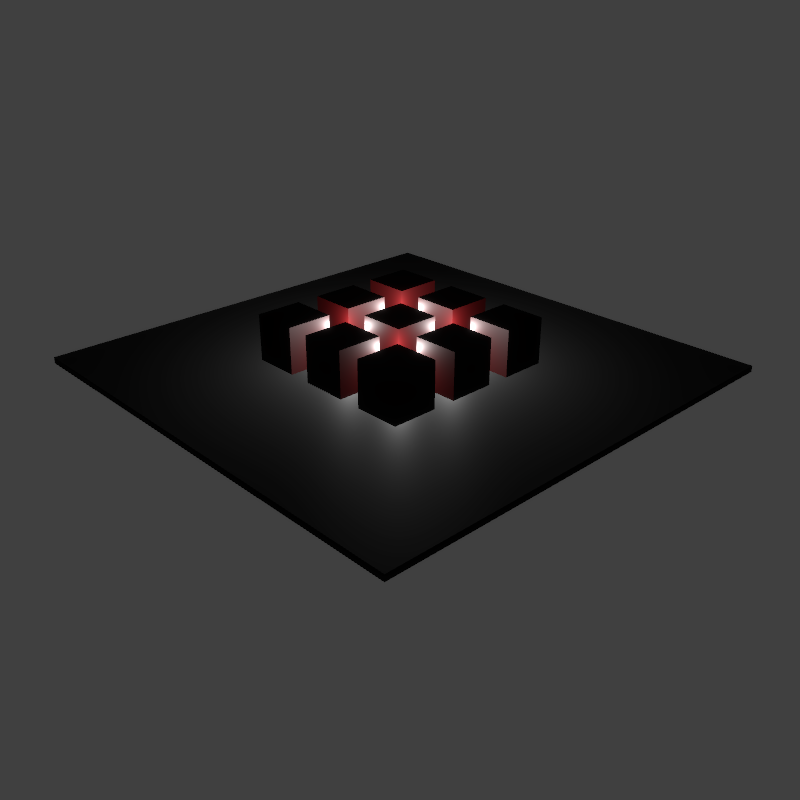
Light tiling is done! ^ The last part of that article was my favorite, as I got to do lots of comparison graphs of light tiling with different parameters.
WASM updates🔗
It's been a long time coming, but I finally wrote some proper WASM test infrastructure, and tests.
Running renderling on web is a very high priority for me, as I want to write games that
work everywhere. Now that there are tests that run in a headless Firefox browser, even if not
yet in CI, the WASM target shouldn't lag behind native.
Sat 2 August, 2025🔗
Sat 26 July, 2025🔗
Light tiling progresses!. This work is getting really close, then I can move on to the project plan for next year.
About that - like I mentioned last update, NLnet is giving Renderling another year of funding (and increasing the budget)! I'm stoked.
Next year's project will include contributions to Rust GPU, the gltf crate and others.
Also on the dockett is global illumination...
And I'll be working with a contributor! You might know them! I'll talk more about that later.
Mon 7 July, 2025🔗
Wow! What a long break.
I've switched jobs and moved house (still in New Zealand).
Also, Renderling got picked up for another year of funding, and got an extension on the last milestone for last year's funding!
I'll write more about all of that later. Thank you!
Sun 18 May, 2025🔗
My partner and I bought a house! Quite a distraction.
Sun 11 May, 2025🔗
Today ends my NLNet grant.
It was really cool to be a part of their program, and it has changed the way I feel about OSS.
If you ever have a project you think may help people, I highly recommend applying to one of their grant programs.
Sat 10 May, 2025🔗
Light tiling - calculating frustums, verifying indices, etc
Sat 26 Apr, 2025🔗
More light tiling work continues.
Thu 10 Apr, 2025🔗
Renderling has been selected for round 2 of 2025 NLNet funding!
This means that we're in the running for funding. I'll be putting together some details together about what the next year of development will look like.
Most likely there will be significant contributions to both Rust-GPU and wgpu.
I would also really like to get some ray marched shadows going, and finish up the occlusion culling.
Stay tuned!
Light tiling updates from March🔗
I've made some progress on the last big milestone of 2024 NLNet funding, light tiling.
You can read about it at the dedicated light tiling article:
/articles/live/light_tiling.html
Sat 22 Mar, 2025🔗
It's my partner Briana's birthday! Happy birthday, babe.
Light tiling🔗
I'm starting on light tiling. I've decided to live blog it in one fell swoop, and link it from here.
/articles/live/light_tiling.html
Sun 9 Mar, 2025🔗
Shadow map wrap up!🔗
I'm putting the finishing touches on that PR at the moment.
It looks really hairy, but it's not as big a change as it looks. GitHub's diff is
exploded by the WGSL files. GitHub's UI doesn't seem to be respecting the .gitattributes
of my project, which specifies that *.wgsl binary. There are a couple tricks to force
GitHub to decide that certain files are generated (which my WGSL files are). But those
tricks (namely to use *.wgsl linguist-generated=true) aren't working for me. I've had
a months long support ticket about it where they have me add and remove the attribute
over and over, hoping for a different result. Oh well.
Back to the shadow mapping...
Here's the result!
The obvious difference being that Blender adds a lot of ambient color to the scene. But the shadows are nearly identical!
I'm happy with the outcome.
Sampling from cubemaps in Rust code
The code for sampling from cubemaps in Rust code turned out to be not that complicated! The idea is that you first find which major axis the sampling vector is most aligned with and then you normalize the vector a bit and make sure the other components are pointing in the correct direction.
The tricky part for my work was realizing that inside the cubemap its matrices are left-handed.
The other tricky stuff was about constructing the cubemaps.
Sun 2 Mar, 2025🔗
Hand rolled cubemap sampling🔗
To support point light shadow maps I'm having to build out support for sampling from cubemaps stored in an atlas.
I've lifted out the stage rendering operation into its own struct so that it can be run from the Stage
as well as from a new struct, SceneCubemap.
The next step is to write the cubemap into the atlas and then compare/assert that sampling from the atlas returns results equal to traditional cubemap sampling in a shader.
The setup for that is a little hairy, as I'll have to write a shader to sample from the cubemap and then read that from a buffer onto the CPU.
One cool side-effect of having the ability to do cubemap sampling from the atlas is that the skybox and IBL lighting can all come from the atlas, making the entire system more "bindless". It also puts the library user in control of how much memory they're using for all textures, which will be great for constrained devices like the raspberry pi.
Onto the cubemap sampling🔗
So, without much further ado, here are the shaders that we'll be working with to ensure that our hand-rolled cubemap sampling works in a way that's comparable to the GPU's own sampling:
/// Vertex shader for testing cubemap sampling.
#[spirv(vertex)]
pub fn cubemap_sampling_test_vertex(
    #[spirv(vertex_index)] vertex_index: u32,
    #[spirv(instance_index)] uv_id: Id<Vec3>,
    #[spirv(storage_buffer, descriptor_set = 0, binding = 0)] slab: &[u32],
    out_uv: &mut Vec3,
    #[spirv(position)] out_clip_coords: &mut Vec4,
) {
    let vertex_index = vertex_index as usize % 6;
    *out_clip_coords = crate::math::CLIP_SPACE_COORD_QUAD_CCW[vertex_index];
    *out_uv = slab.read_unchecked(uv_id);
}

/// Vertex shader for testing cubemap sampling.
#[spirv(fragment)]
pub fn cubemap_sampling_test_fragment(
    #[spirv(descriptor_set = 0, binding = 1)] cubemap: &spirv_std::image::Cubemap,
    #[spirv(descriptor_set = 0, binding = 2)] sampler: &spirv_std::Sampler,
    in_uv: Vec3,
    frag_color: &mut Vec4,
) {
    *frag_color = cubemap.sample(*sampler, in_uv);
}
This will render a quad that samples from one UV coordinate. I'll use this to ensure:
Native GPU cubemap sampling works as I expect it to.
The hand-rolled cubemap sampling works as I expect it to.
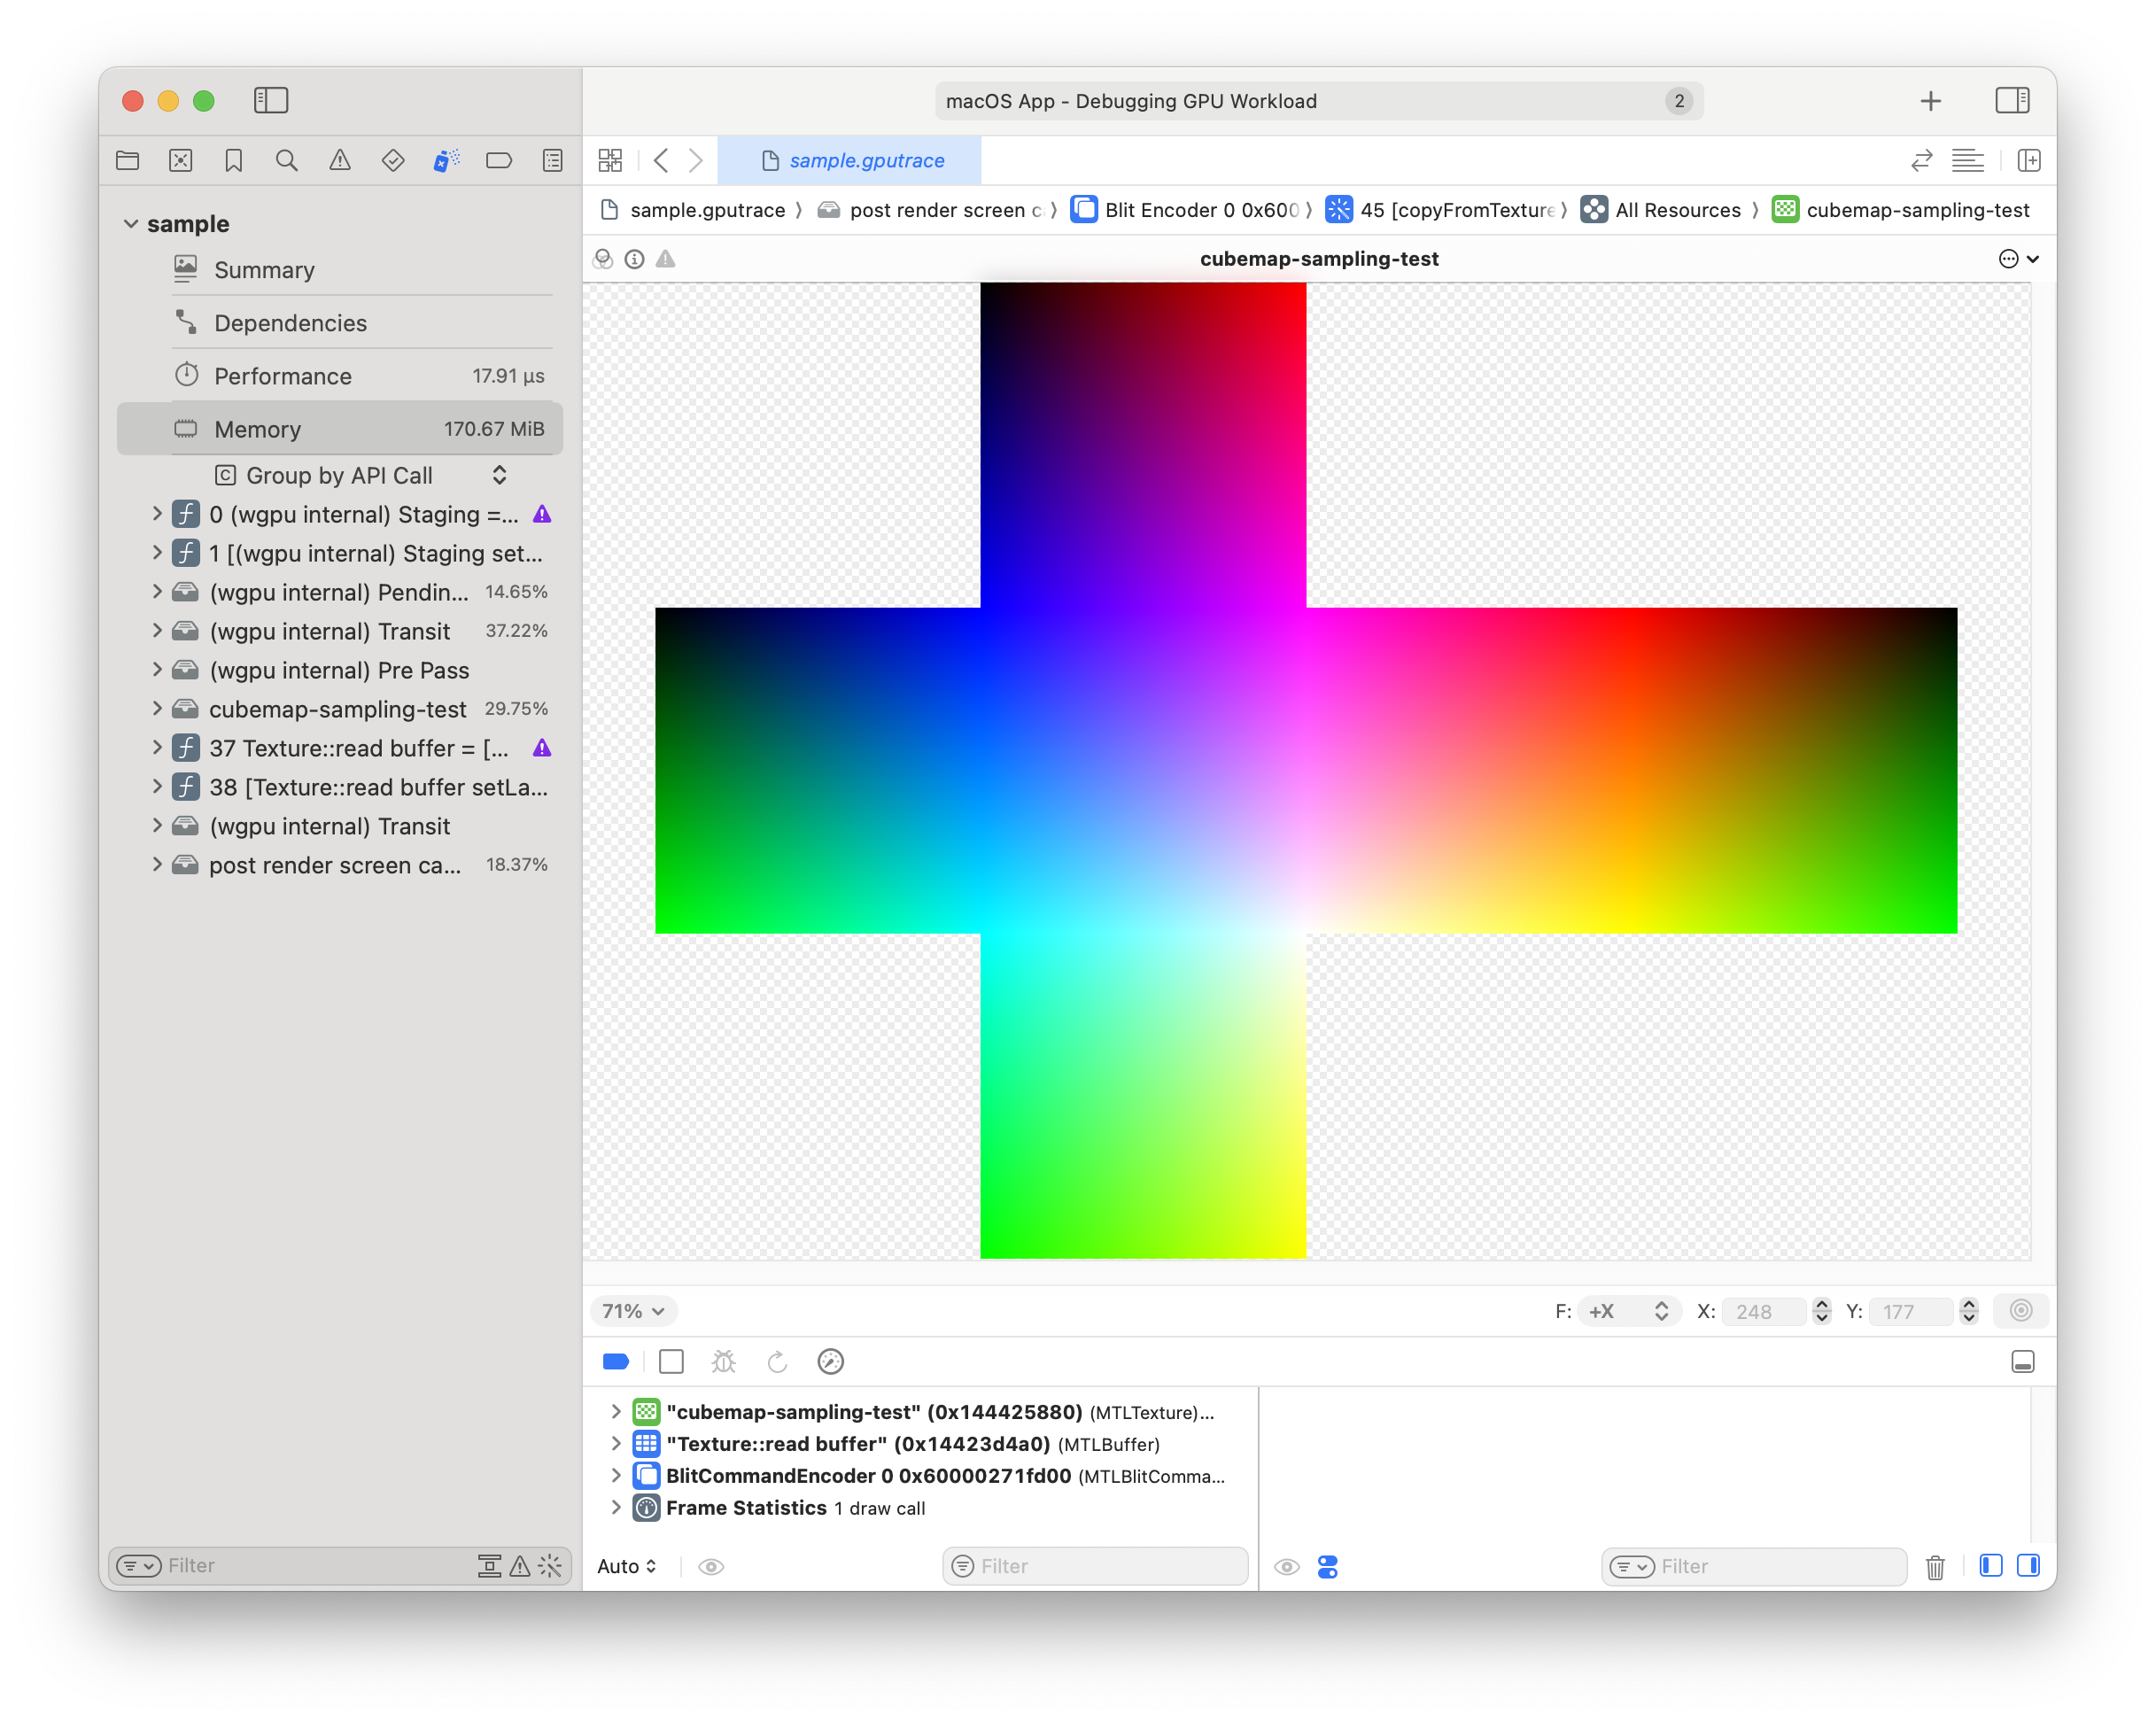
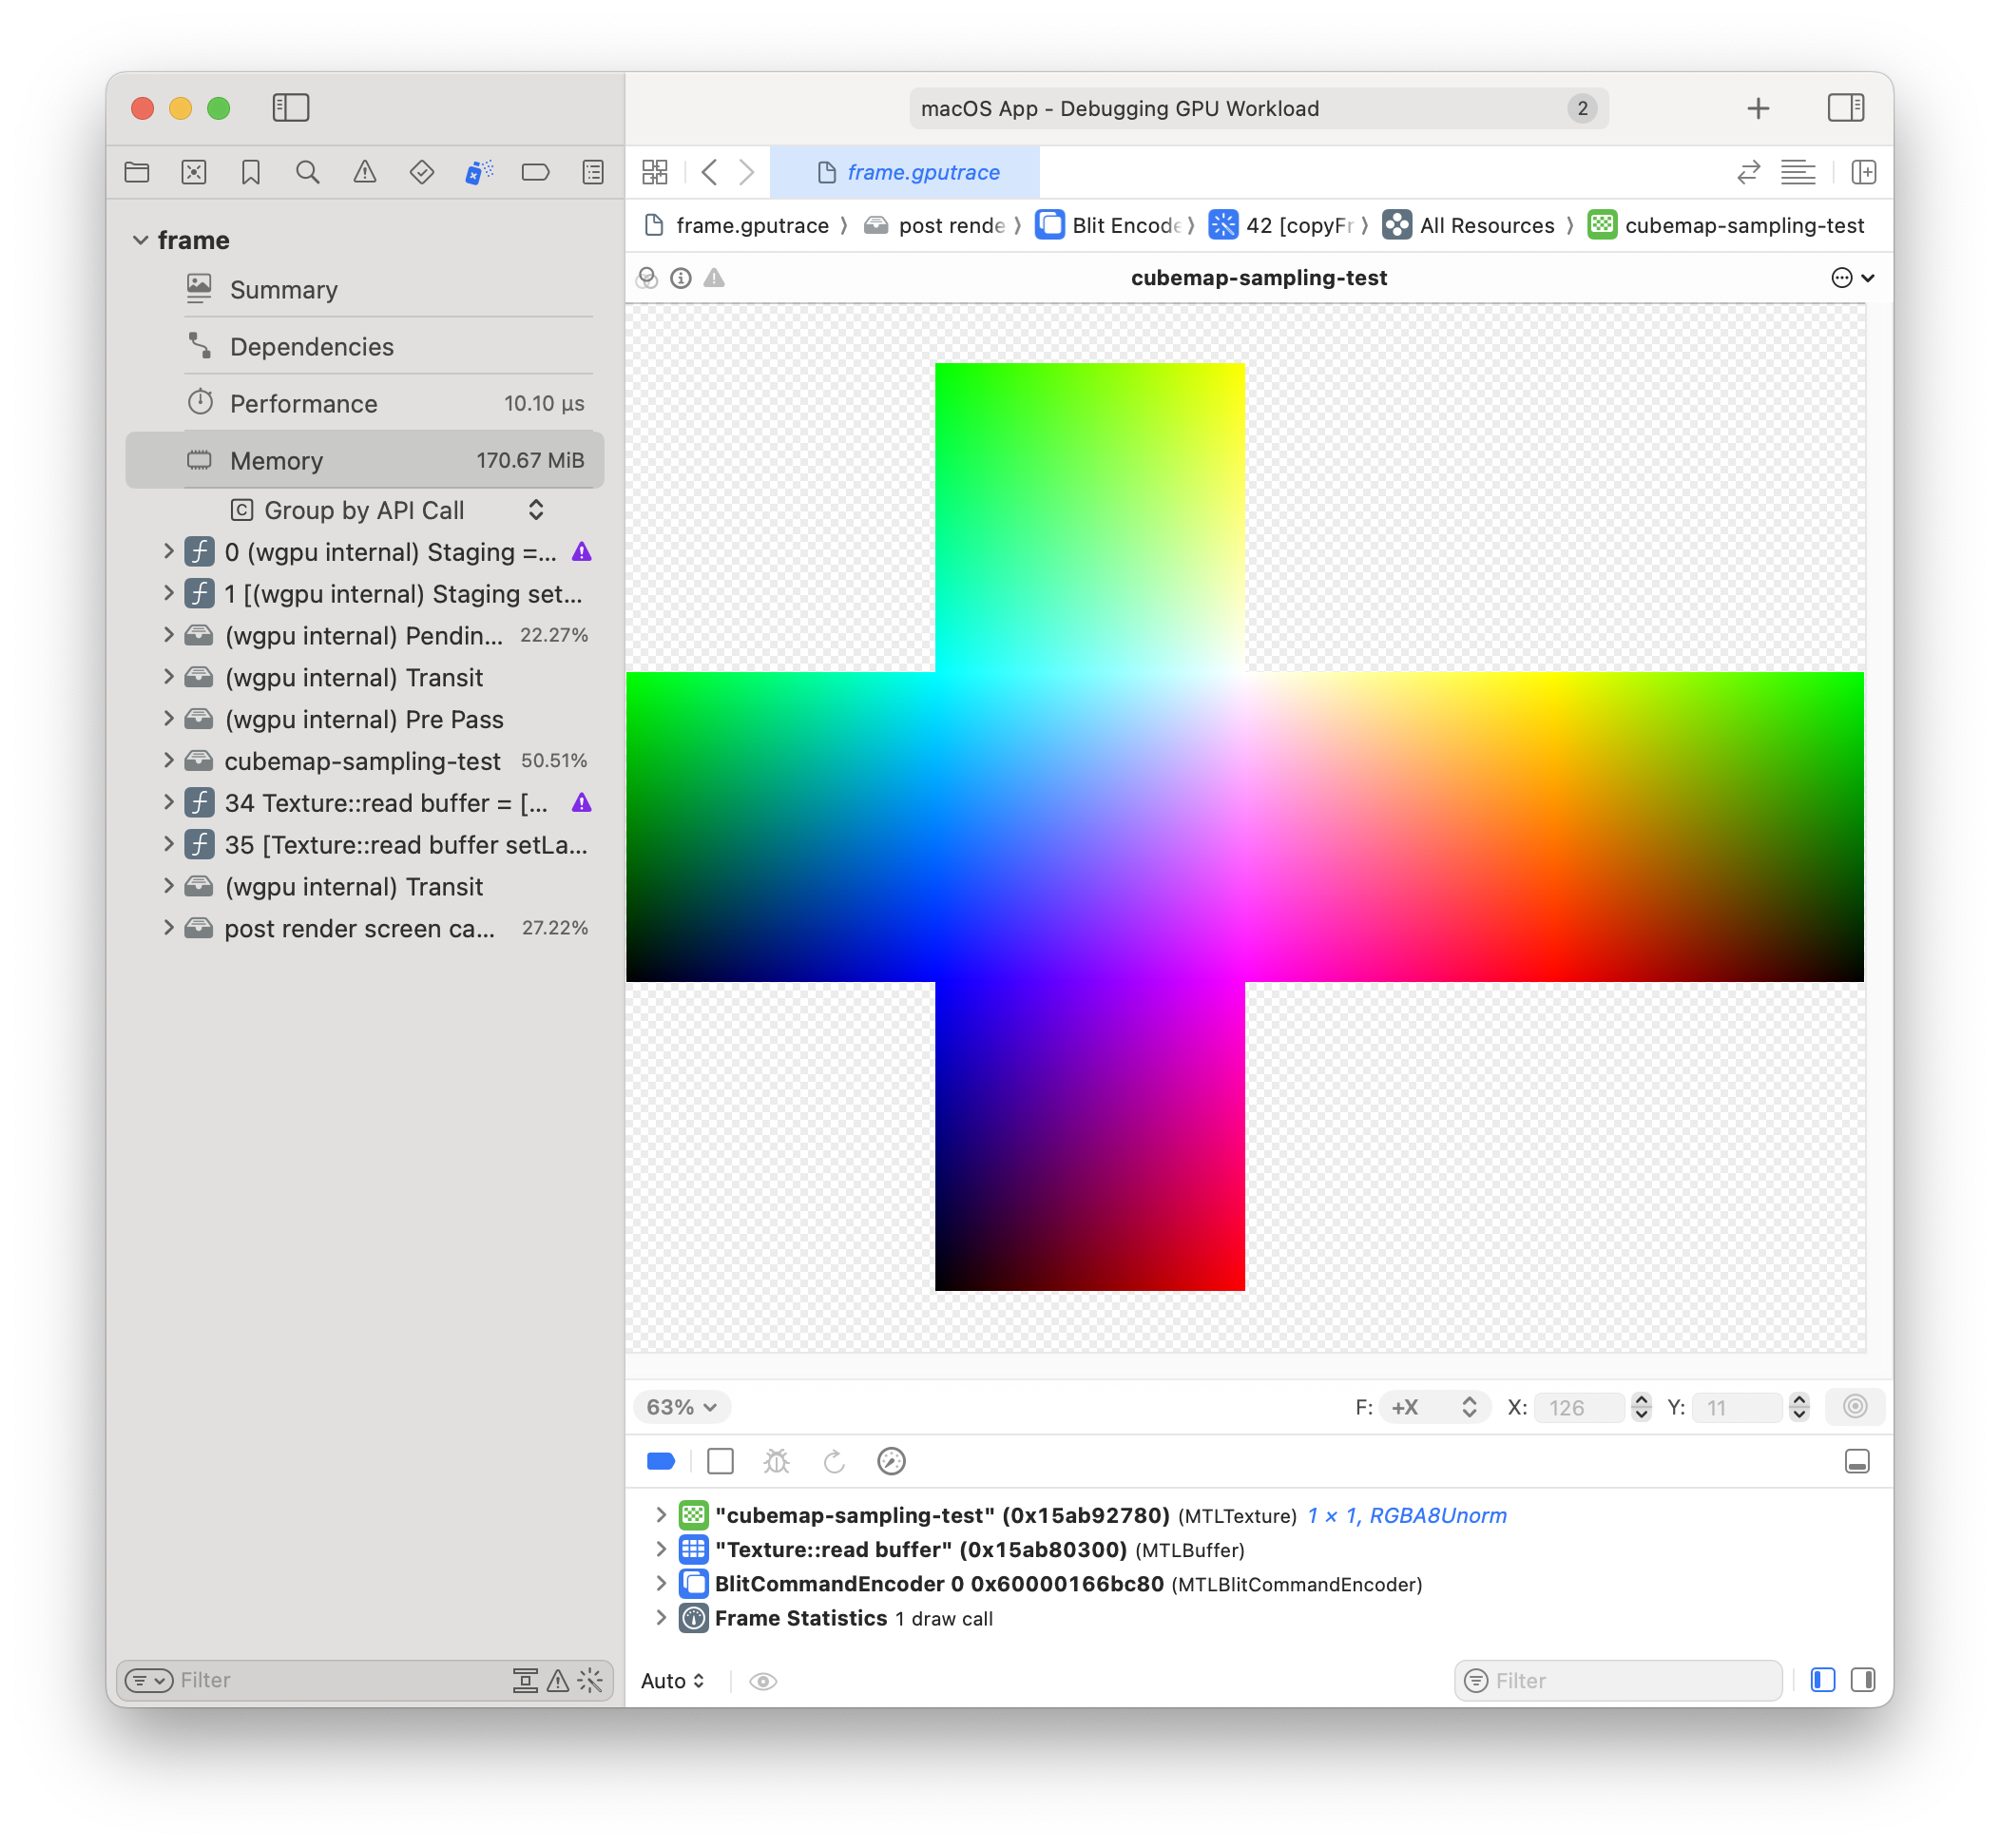
...and here is our cubemap as seen from a GPU trace:
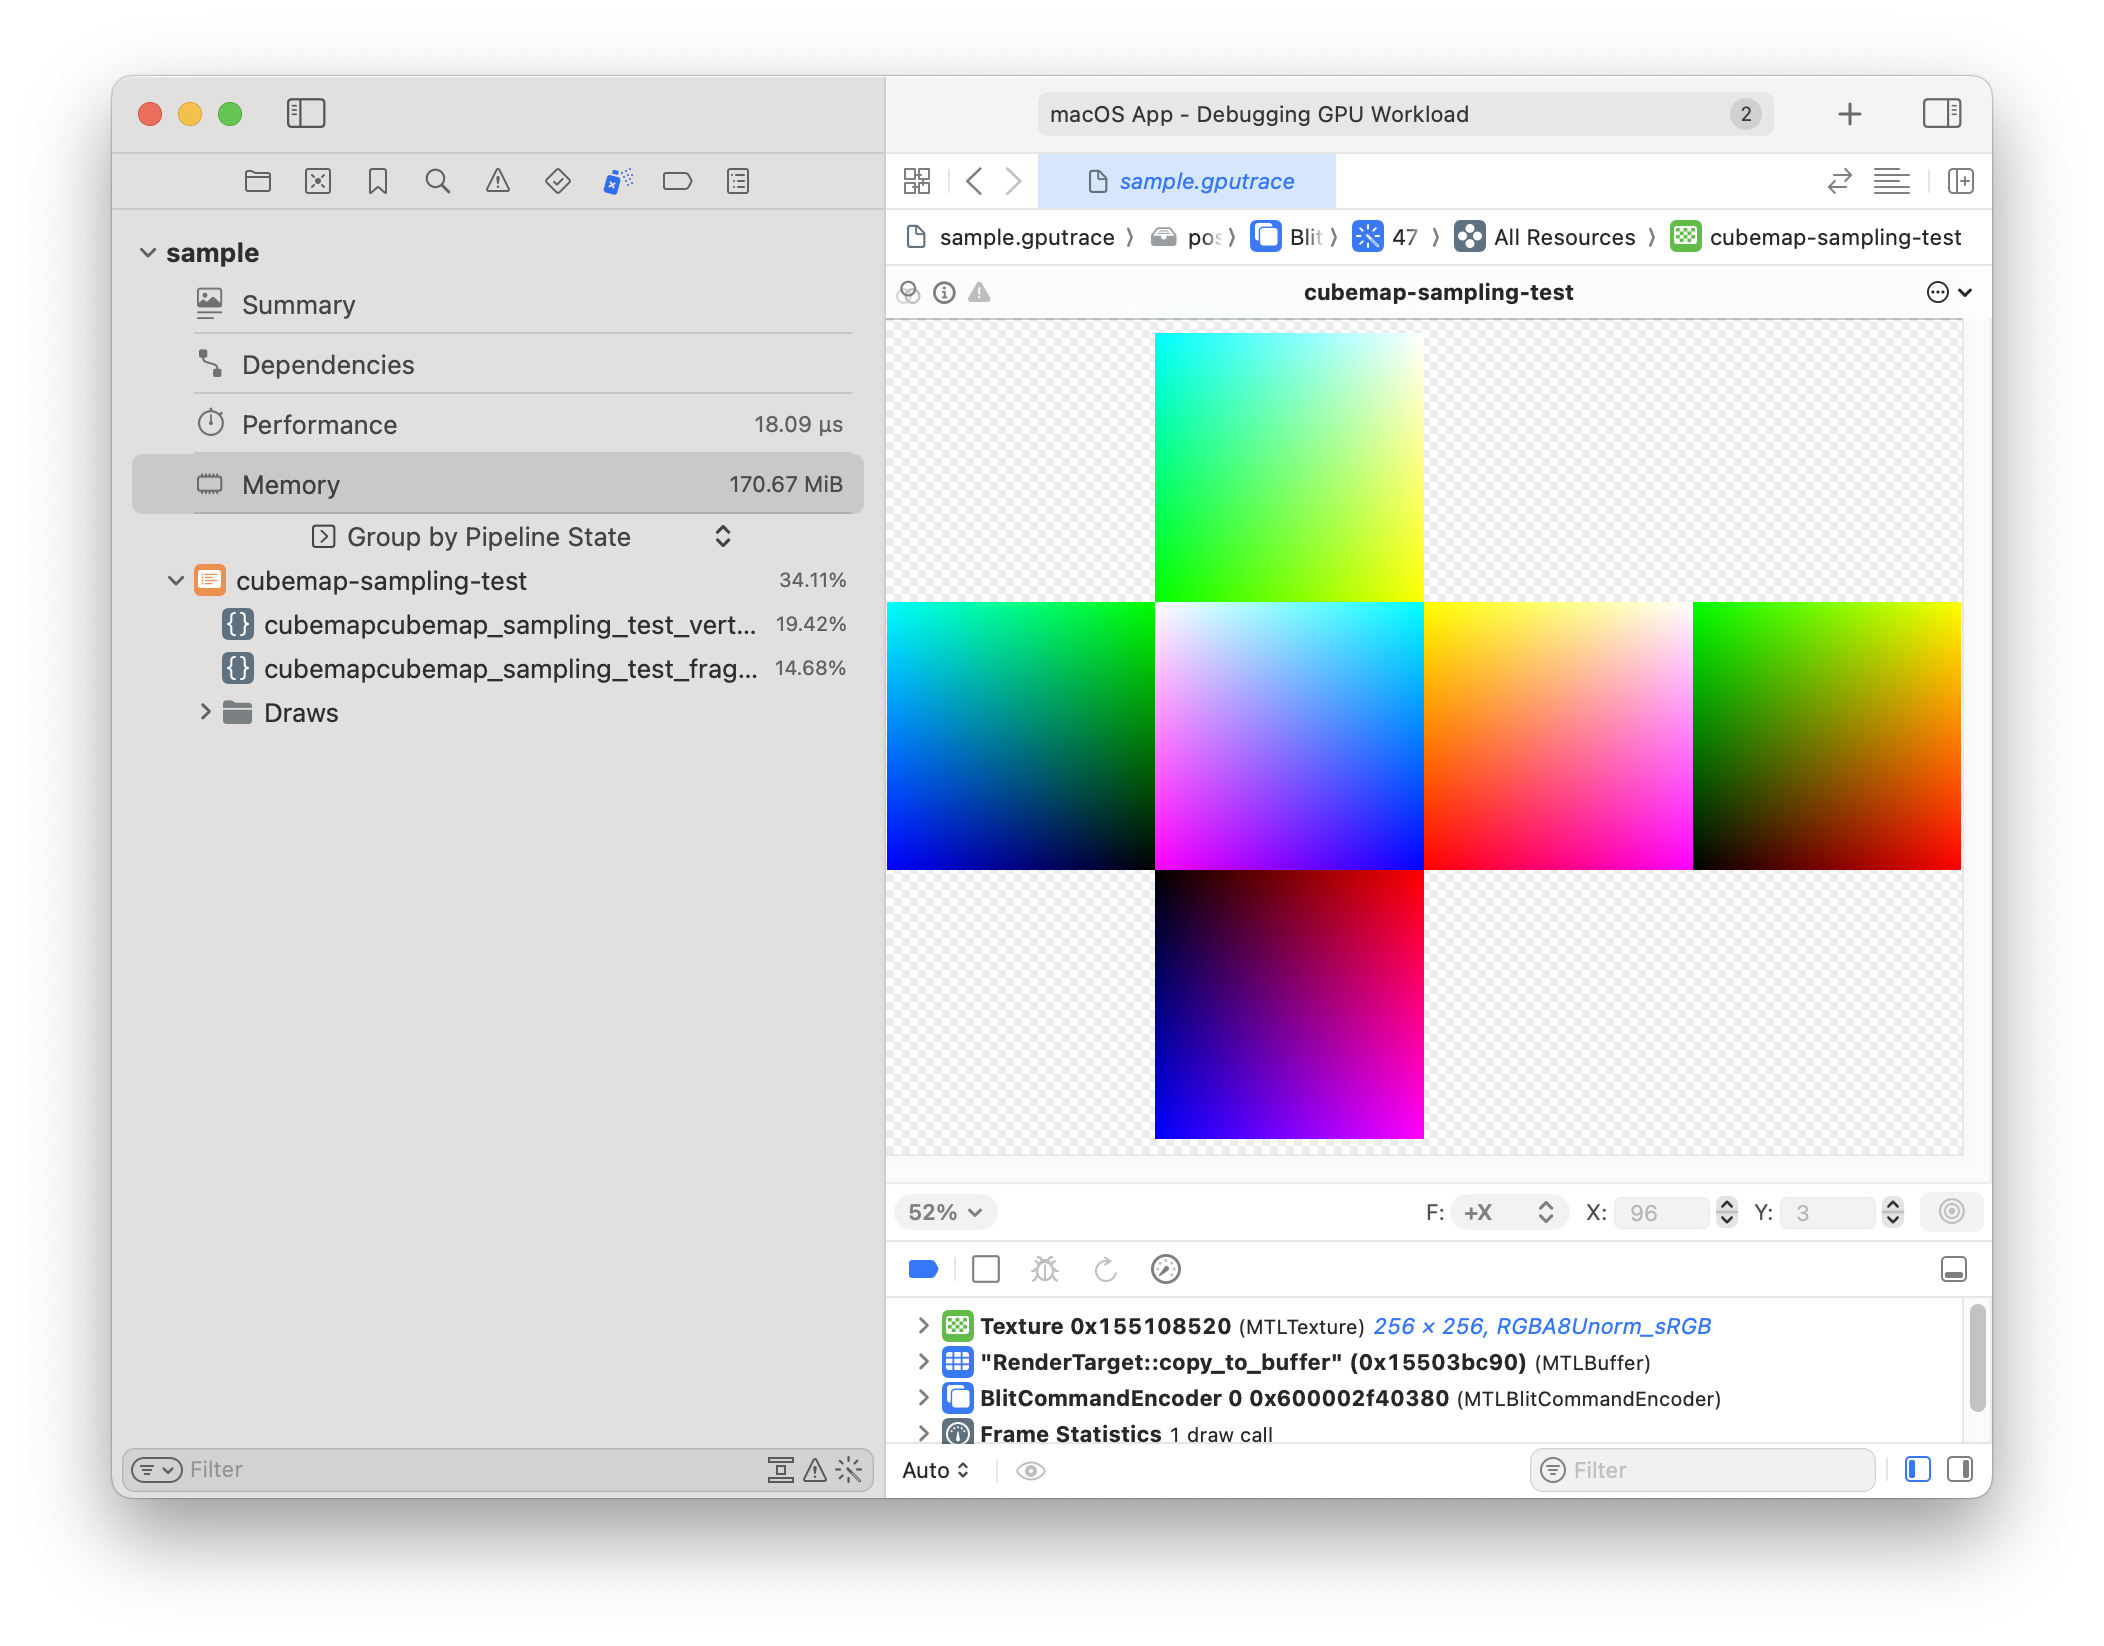
...eh, that doesn't seem right. The sides of the cube should all blend together and look like an unfolded box.
Looks like the internal representation of a cubemap is maybe more... ...specific than I thought.
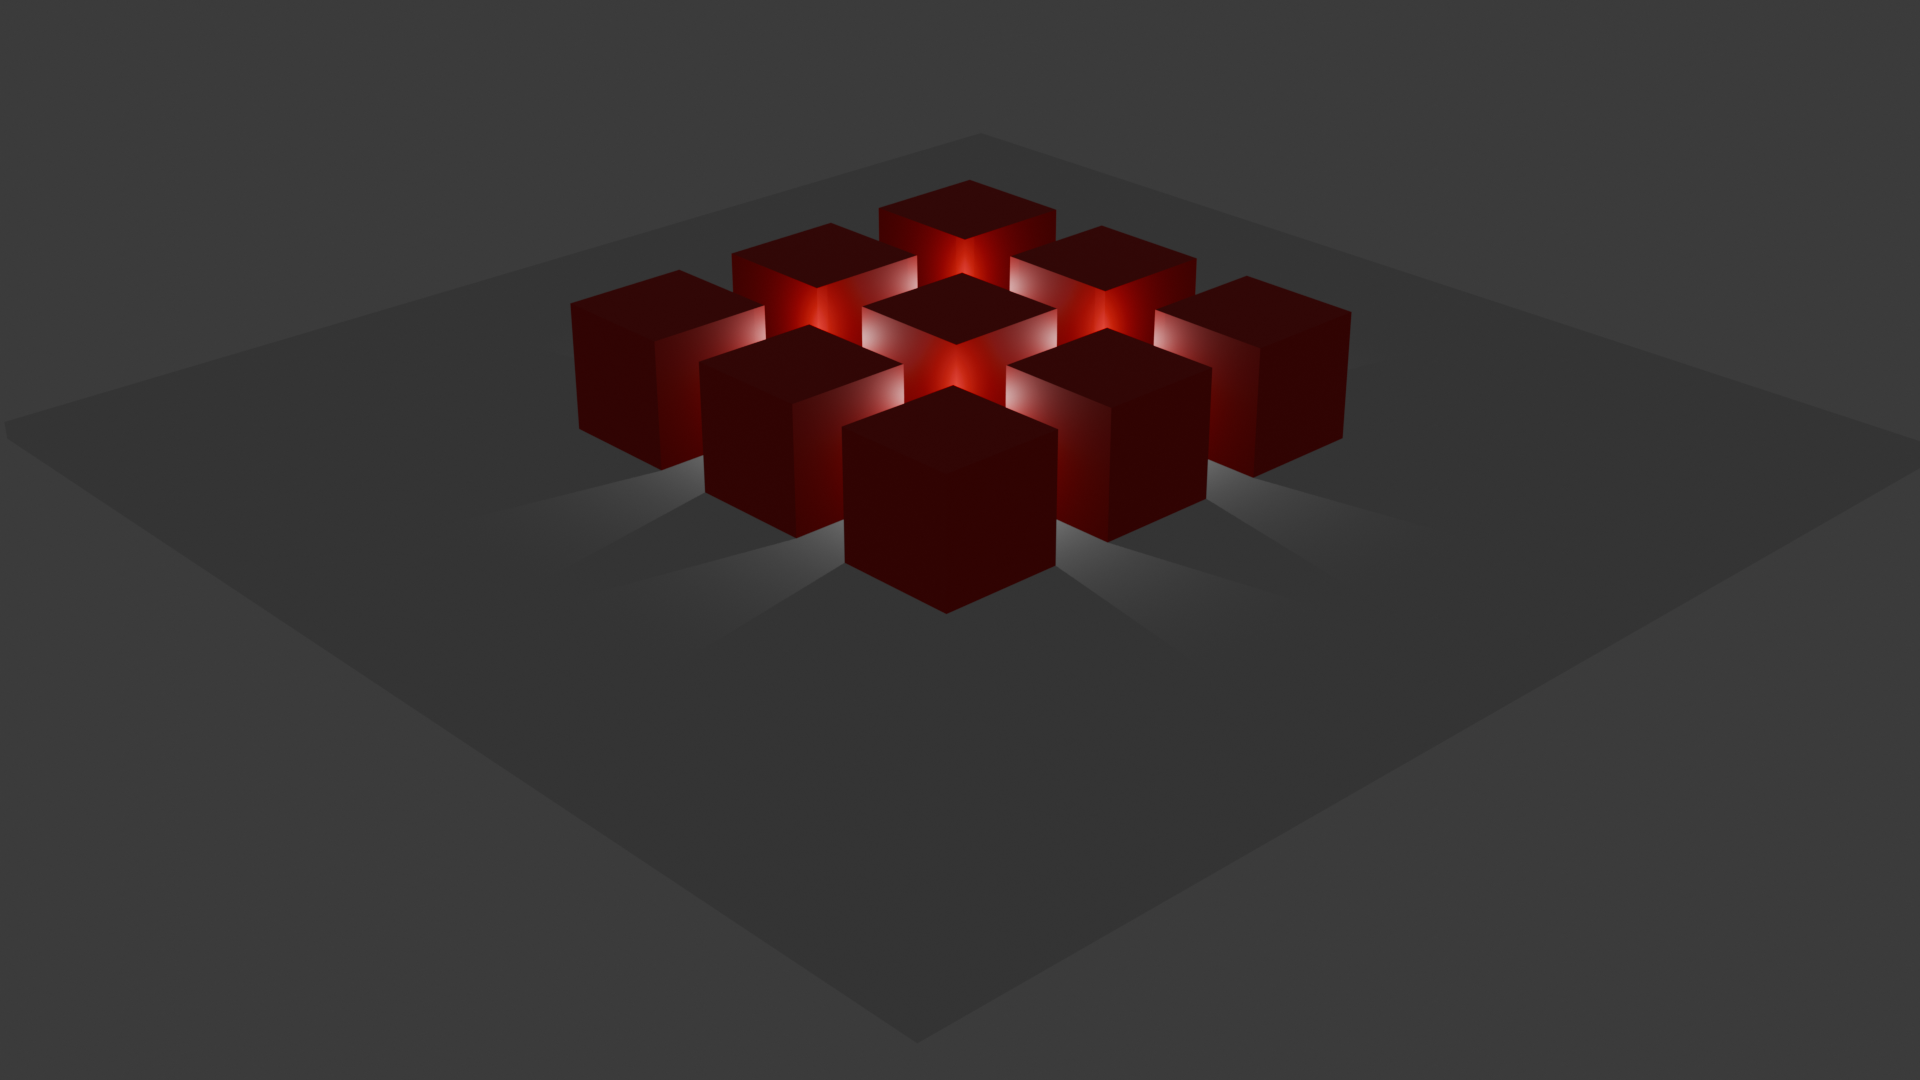
Let's look at the cubemap that I use for a skybox:
Ah, yeah. Here you can see that the sides just flow from one to another. So I think my matrices are out of whack. I bet we have to render upside down, too, to get the textures to flip.
This will probably affect the coordinates used to sample. I don't think I can expect that sampling
with (1.0, -1.0, -1.0) will produce red.
Actually - I'm going to try flipping the color's Y coords just to see, because it seems like the white point should be in the upper right instead of the lower right...
There we go! Now sampling does come out as expected.
Debugging the CPU cubemap sampling algo🔗
The sampling algorithm is going to perform these steps:
Determine the face:
Compare the absolute values of the x, y, and z components of the input
coord.The component with the largest absolute value determines the primary direction.
Select the face and calculate 2D coordinates:
For each possible face (±X, ±Y, ±Z), after determining the face, project the vector onto the plane of that face to get u, v coordinates.
These normalized coordinates are then converted to pixel coordinates for sampling from the image.
Fetch the texel value from the determined face using bilinear interpolation for smooth results.
Return the final color: With proper scaling and orientation adjustments.
With an initial implementation of the sampling algorithm I've printed out the input uv coord, the GPU sample value, the CPU sample value and then also the face index and the 2d uv coords that were determined by the algo:
  uv: [1, 0, 0],
 gpu: [1, 0.49803922, 0.49803922, 1]
 cpu: [0.5019608, 0.5019608, 0, 1]
from: +X(0) [0.5, 0.5]

  uv: [-1, 0, 0],
 gpu: [0, 0.49803922, 0.5019608, 1]
 cpu: [0.49803922, 0.5019608, 1, 1]
from: -X(1) [0.5, 0.5]

  uv: [0, 1, 0],
 gpu: [0.5019608, 1, 0.5019608, 1]
 cpu: [0.49803922, 1, 0.49803922, 1]
from: +Y(3) [0.5, 0.5]

  uv: [0, -1, 0],
 gpu: [0.5019608, 0, 0.49803922, 1]
 cpu: [0.49803922, 0, 0.5019608, 1]
from: -Y(2) [0.5, 0.5]

  uv: [0, 0, 1],
 gpu: [0.5019608, 0.49803922, 1, 1]
 cpu: [0, 0.5019608, 0.49803922, 1]
from: +Z(4) [0.5, 0.5]

  uv: [0, 0, -1],
 gpu: [0.49803922, 0.49803922, 0, 1]
 cpu: [1, 0.5019608, 0.5019608, 1]
from: -Z(5) [0.5, 0.5]
So, it's already kinda correct. You can see that it gets the face index correct for the input coords. It also seems that the computed 2d uv coords are correct... ...that leaves the sampling itself, or the images as copied out of the cubemap.
Let's look at the images as read out of our GPU cubemap:


Hrm. Well it looks like they're correct in that they definitely represent the sides of the cubemap. I can tell by comparing them to the cubemap screenshot above.
Let's just take the first case into question:
  uv: [1, 0, 0],
 gpu: [1, 0.49803922, 0.49803922, 1]
 cpu: [0.5019608, 0.5019608, 0, 1]
from: +X(0) [0.5, 0.5]
It's getting the index correct, and the location. If we sample from the +X image at (0.5, 0.5), which is
(127.5, 127.5) in pixels, we should get something like (1.0, 0.5, 0.5, 1.0). So then why is it returning
(0.5019608, 0.5019608, 0, 1)?
...
Oh. 🤦. When constructing the CPU cubemap after reading the images from the GPU, I used this:
let cpu_cubemap = [
    images.pop().unwrap(),
    images.pop().unwrap(),
    images.pop().unwrap(),
    images.pop().unwrap(),
    images.pop().unwrap(),
    images.pop().unwrap(),
];
...instead of this:
let cpu_cubemap = [
    images.remove(0),
    images.remove(0),
    images.remove(0),
    images.remove(0),
    images.remove(0),
    images.remove(0),
];
Ok. So after fixing that blunder, things are working out. Now I've set a threshold for an acceptable distance between the GPU and CPU sample values and will start working on interpolation and multisampling.
But also - what happens when you pass in Vec3::ZERO as the uv coords? I bet it interpolates between
corners or something.
...
Ok, maybe I shouldn't work on multisampling just yet. It isn't completely necessary to finish shadow mapping. I can always circle back later.
...
Eh, multisampling wasn't that hard. Now I have all the cardinal directions sampled:
__uv: [1, 0, 0],
_gpu: [1, 0.49803922, 0.49803922, 1]
_cpu: [1, 0.49803922, 0.49803922, 1]
mcpu: [1, 0.49882355, 0.49882355, 1]
from: +X(0) [0.5, 0.5]

__uv: [-1, 0, 0],
_gpu: [0, 0.49803922, 0.5019608, 1]
_cpu: [0, 0.49803922, 0.5019608, 1]
mcpu: [0, 0.49882355, 0.5011765, 1]
from: -X(1) [0.5, 0.5]

__uv: [0, 1, 0],
_gpu: [0.5019608, 1, 0.5019608, 1]
_cpu: [0.5019608, 1, 0.5019608, 1]
mcpu: [0.5011765, 1, 0.5011765, 1]
from: +Y(2) [0.5, 0.5]

__uv: [0, -1, 0],
_gpu: [0.5019608, 0, 0.49803922, 1]
_cpu: [0.5019608, 0, 0.49803922, 1]
mcpu: [0.5011765, 0, 0.49882355, 1]
from: -Y(3) [0.5, 0.5]

__uv: [0, 0, 1],
_gpu: [0.5019608, 0.49803922, 1, 1]
_cpu: [0.5019608, 0.49803922, 1, 1]
mcpu: [0.5011765, 0.49882355, 1, 1]
from: +Z(4) [0.5, 0.5]

__uv: [0, 0, -1],
_gpu: [0.49803922, 0.49803922, 0, 1]
_cpu: [0.49803922, 0.49803922, 0, 1]
mcpu: [0.49882355, 0.49882355, 0, 1]
from: -Z(5) [0.5, 0.5]
It's interesting, though, that the multisample mcpu value seems to be further from the GPU value.
Let's add the corners in...
Huh! Event with the corners, sampling in a cone around the direction vector and averaging comes out worse. No need for it, then!
Oh! And it turns out that if you sample a cubemap with Vec3::ZERO, it just uses Vec3::X instead.
After thinking about it, that makes sense.
So now we have our sampling algorithm written on the CPU!
Now we can adapt it to sampling images off the slab.
Sun 23 Feb, 2025🔗
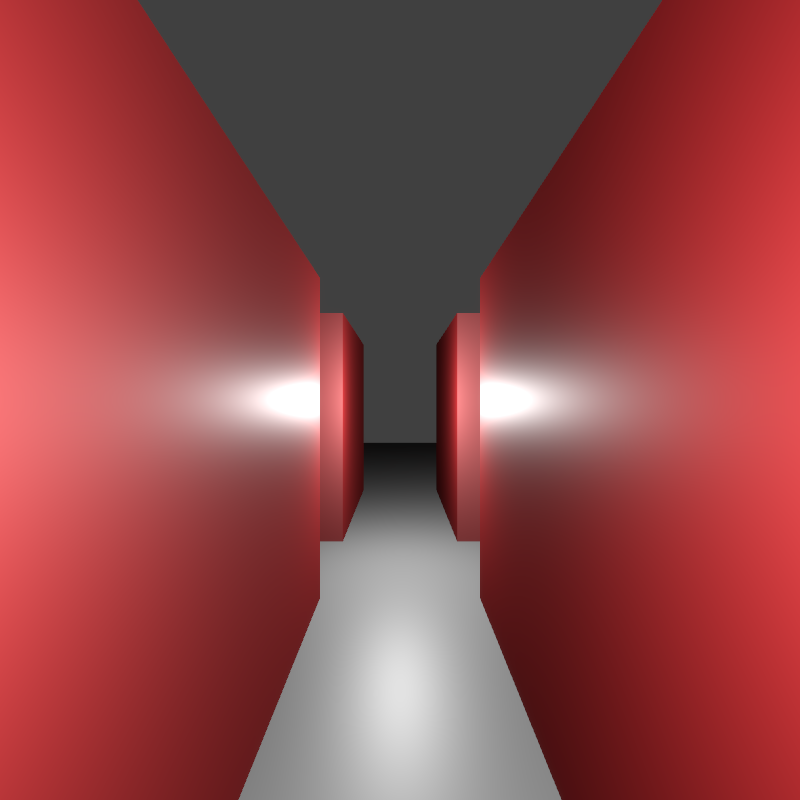
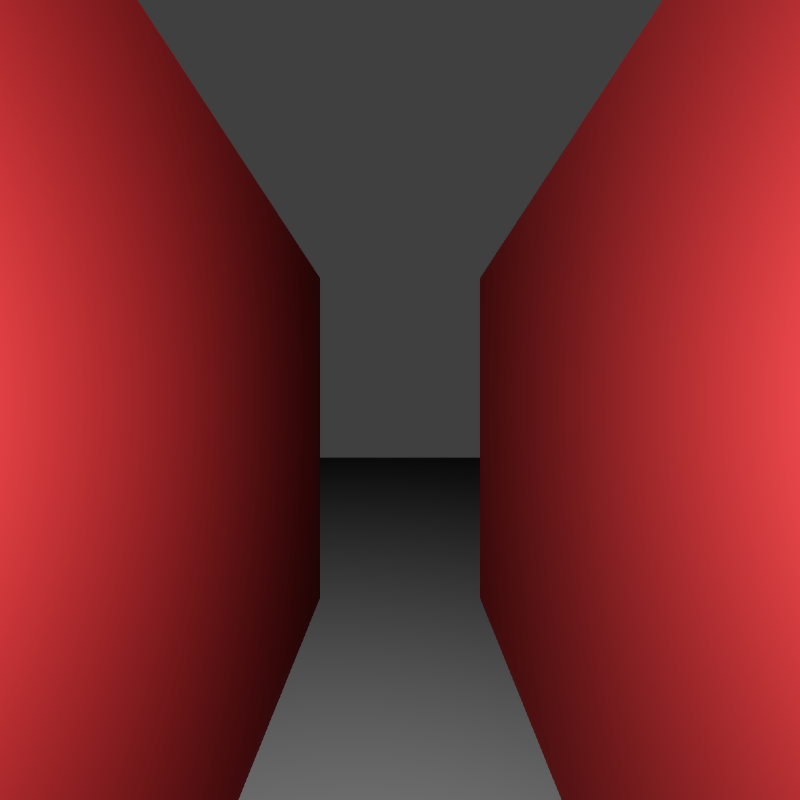
Point light shadow mapping update🔗
I've updated the shadow mapping code to include point light parsing out of GLTF files, which I had commented out while working on directional and spot lights.
Now point light shadow maps are being created, which are essentially six separate shadow maps, collected into a cube map.
Here's an example of the six separate perspectives that make up the cube map:
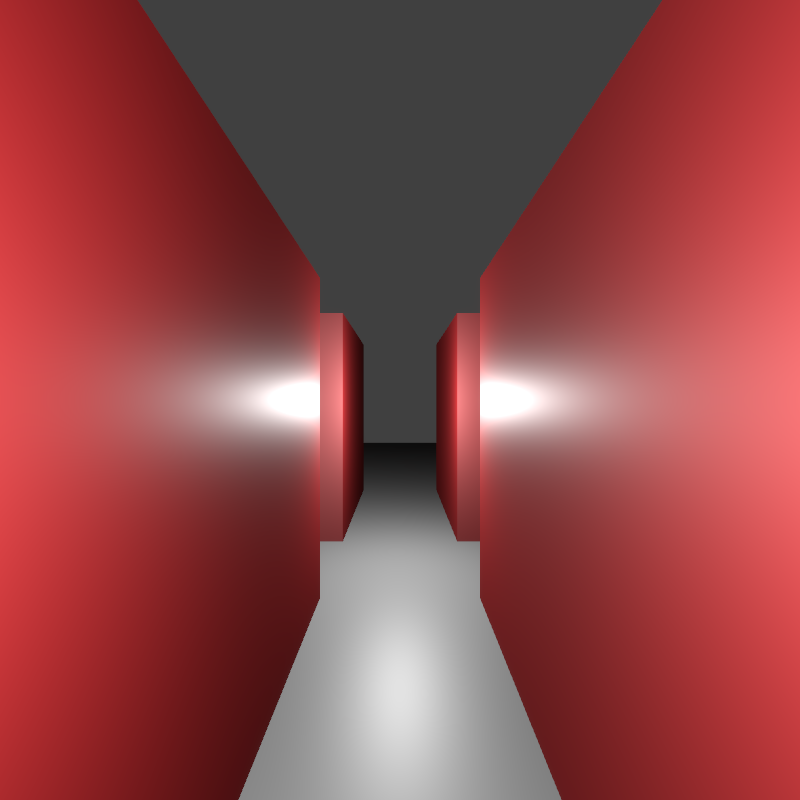


These are then blitted into the shadow map atlas so they can be bound in the PBR shader together for multi-shadow-map shading:


I have a feeling there's a lot of repacking happening in the shadow map atlas... ... but that's for another time :)
The next step is to support sampling the cube maps as they are stored in the atlas.
Lucky for me we have a reference implementation in the GPU itself.
So this should be a matter of writing a series of unit tests.
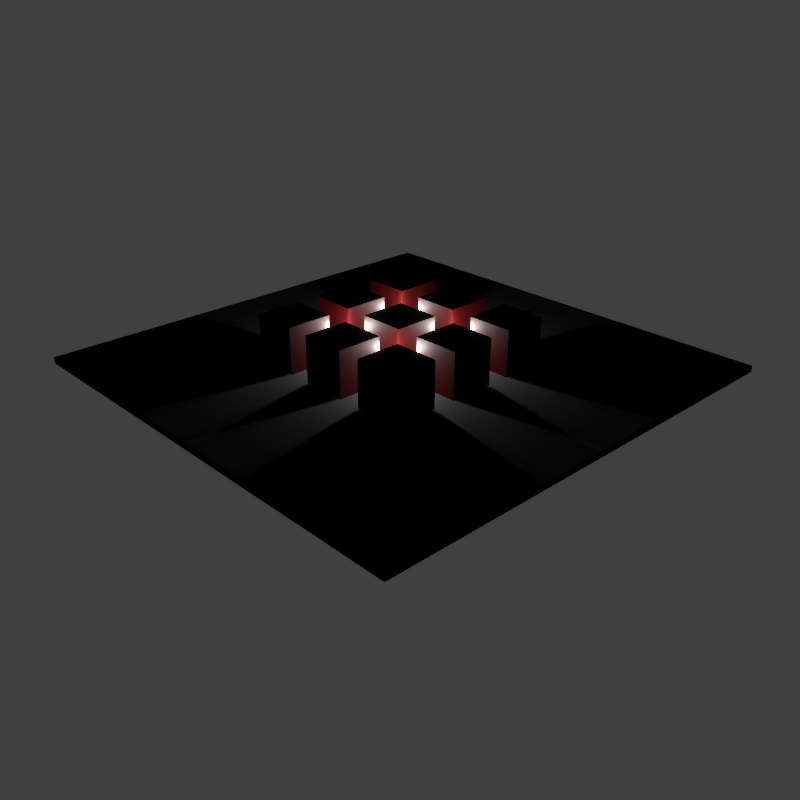
Hand rolling cube-map sampling
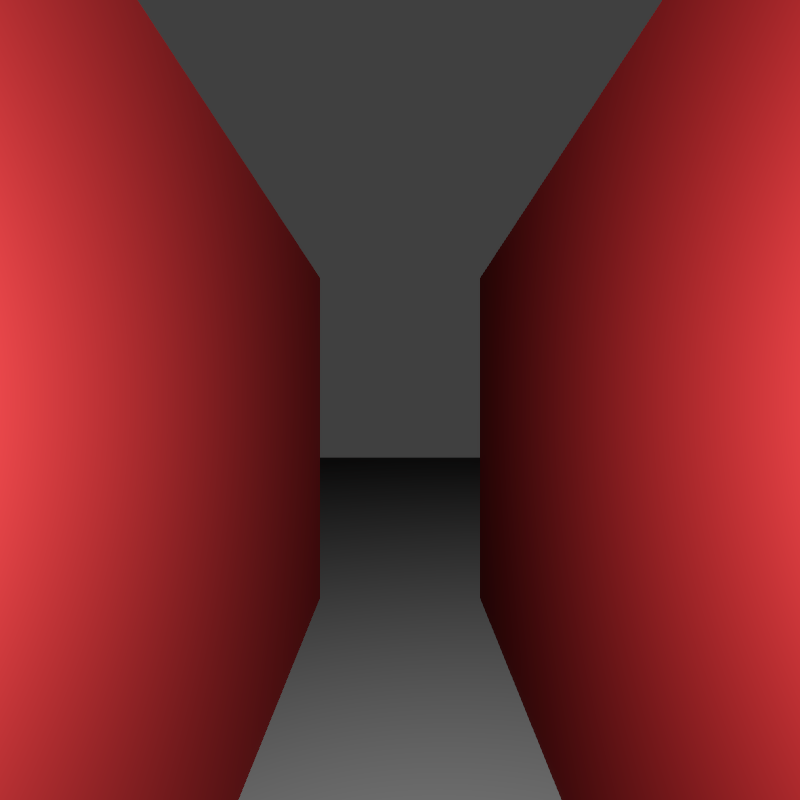
I'm going to start by creating a cubemap with known, colored corners:
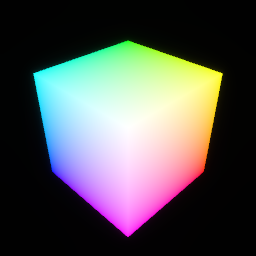
This cubemap is nice because it's conceptually simple, and we should be able to verify that our sampling is correct without having to think too hard.
For example, sampling at (1.0, 1.0, 1.0) should return white, whereas sampling at
(-1.0, -1.0, -1.0) should return black.
Furthermore, sampling at (1.0, -1.0, -1.0), (-1.0, 1.0, -1.0) and (-1.0, -1.0, 1.0), should
return red, green and blue, respectively.
So this will not only allow us to verify the hand-rolled cubemap sampling we'll be writing, but it will also help us verify that the cubemap itself is put together correctly.
Let's construct the cubemap...
Sat 22 Feb, 2025🔗
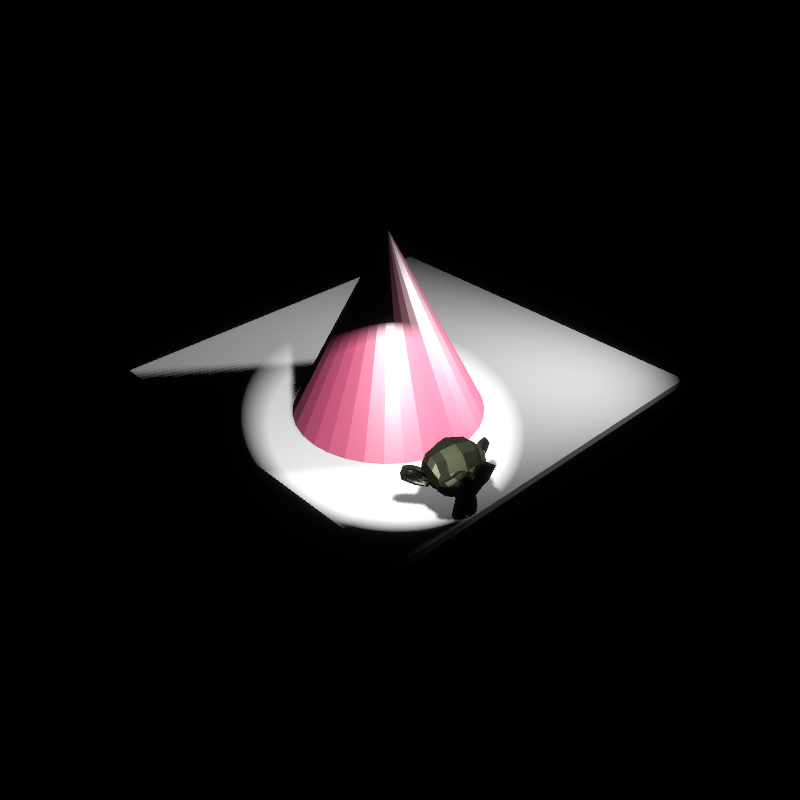
Glorious multi-shadow mapping for spot lights🔗
The only thing I needed to change (as far as shadow mapping) to support spot lights was to allow the library
user to provide a z_near and z_far for the light space projection.
I also had to fix spot lights' outgoing radiance calculations, as they were buggy to begin with, but now they're great!
Now for the last bit of shadow mapping work, support for point lights🔗
This will probably be the most complicated part, aside from all the architecture work it took to get to this point.
Point lights are special in that they cast light in all directions, which means to shadow map them we need to render depth to a cube map.
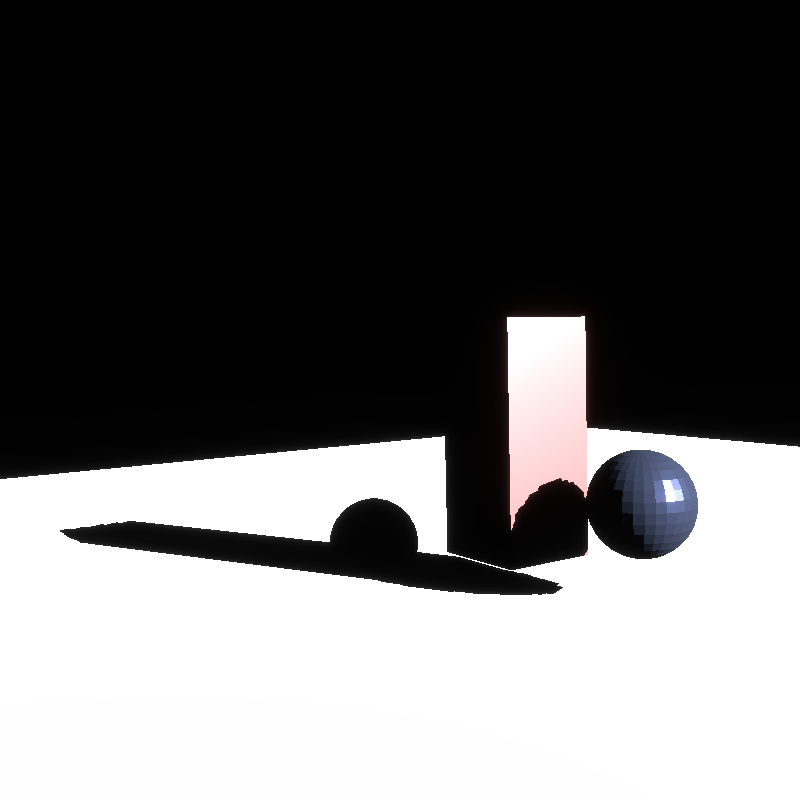
Here is our test scene as rendered in Blender with the EEVEE renderer:
And without any changes to Renderling, here's that same scene in Renderling:

Obviously the intensity is blown out. I still haven't settled on a unit for lighting. I'm roughly using candelas at the moment, but I need to focus on this at some point.
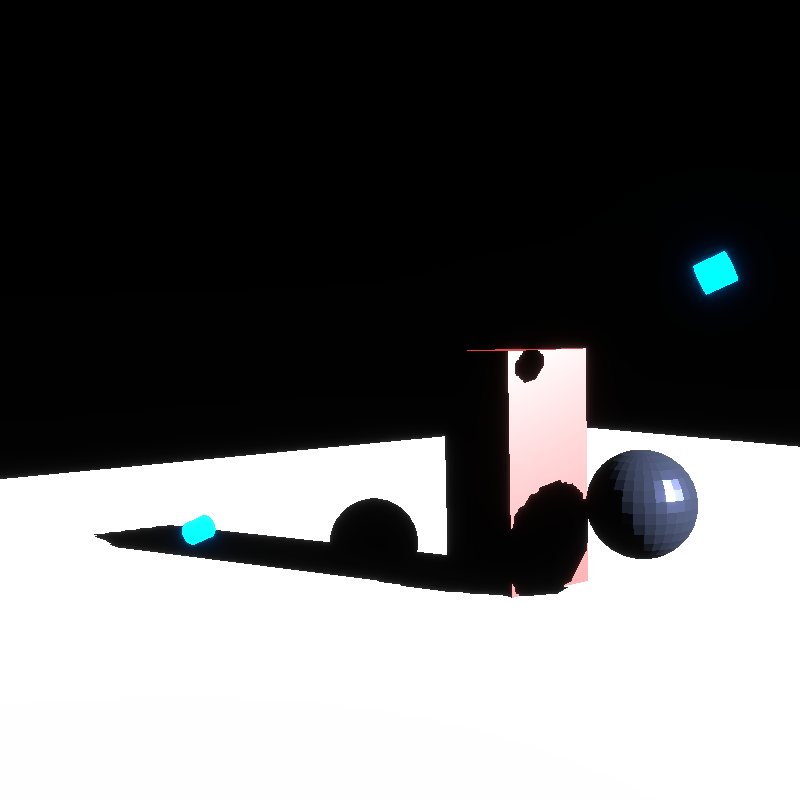
If I adjust the intensity of point lights coming from GLTF files the same way I do for spot lights we get this rendering:
That seems to make the intensity too low. But also, it looks like the point lights are lighting the base incorrectly.
Oh! It's because the base doesn't have a material, so it's defaulting to unlit.
I'll also adjust the intensity adjustment to be the same as directional lighting - that will make it more intense but let's just see how that looks:
Huh! Better. I'll roll with that for now.
Sat 15 Feb, 2025🔗
Glorious multi-shadow mapping🔗
There it is! It looks great! It's such a simple scene, but it's the culmination of so much work.
What's amazing is that I didn't change anything in Renderling since last week.
I stumbled across this rendering when modifying the test, which means the library code
under test is for the most part correct.
My guess is that there's something up with synchronization, because the change I made to the test rendered one frame without shadow mapping, and then another with shadow mapping, and the rendering with shadow mapping is what you see above.
Debugging shadow mapping synchronization issues🔗
Interestingly, it seems that merely rendering one frame of the scene first doesn't fix the issue. Instead, we must render one frame before creating the shadow maps.

If we render two frames after creating the shadow maps we see the same results as not creating any shadow maps.
That suggests that there's something special about the Stage::render function when run without shadow maps.
...
This actually might be incredibly simple, and hence why I've missed it.
The geometry slab is 64 bytes after the shadow map update, before
Stage::render.The geometry slab is 8 Kib after calling
Stage::render.
...I think this is a simple case of not synchronizing the geometry slab buffer. It probably has no geometry in it when the shadow maps are updated.
🤦
That's it!
Easy.
So this uncovers an issue with the current version of craballoc
(which manages the slabs), where there's no way to tell if the slab has any queued updates.
I'll change that now and then use that to ensure that the geometry slab gets committed before updating any
shadow maps.
...
And now it looks like everything is hunky dory:
😊
Sun 9 Feb, 2025🔗
Multiple shadow maps, hooking it all up🔗
I left off yesterday without shadows being rendered in the main renderer path.
I think this is because the shadow mapping is using the new "lighting slab" and expects everything related to lights and shadows to live there, whereas the stage/PRB shaders still think all that data is on the "geometry slab" (as I'm now calling it).
...
Ok - after running a few GPU traces on the main render function I can see that I missed a couple more writes to the slab.
After adding the necessary Ids, etc., it looks like I might have one last batch
of coordinate transformations to fix.
...
I fixed reading atlas images according to the atlas's underlying texture format.
I guess that means I've also (for the most part) finished support for different
texture formats in different Atlass.
Previously the Atlas's format had to be Rgba8.
...
Last thing to check are those sampling coordinates...
...
Ok, it looks like something really spooky happened. The stage/geometry slab is getting overwritten immediately. I'm thinking that maybe I passed the geometry slab to something that is expecting the light slab...
...
Nope! It was easier than that.
The Atlas now writes a descriptor of itself for shaders to access, but that means
the PBR descriptor must be written first, or it won't occur at index 0.
The Atlas was being created before the descriptor was getting written.
...
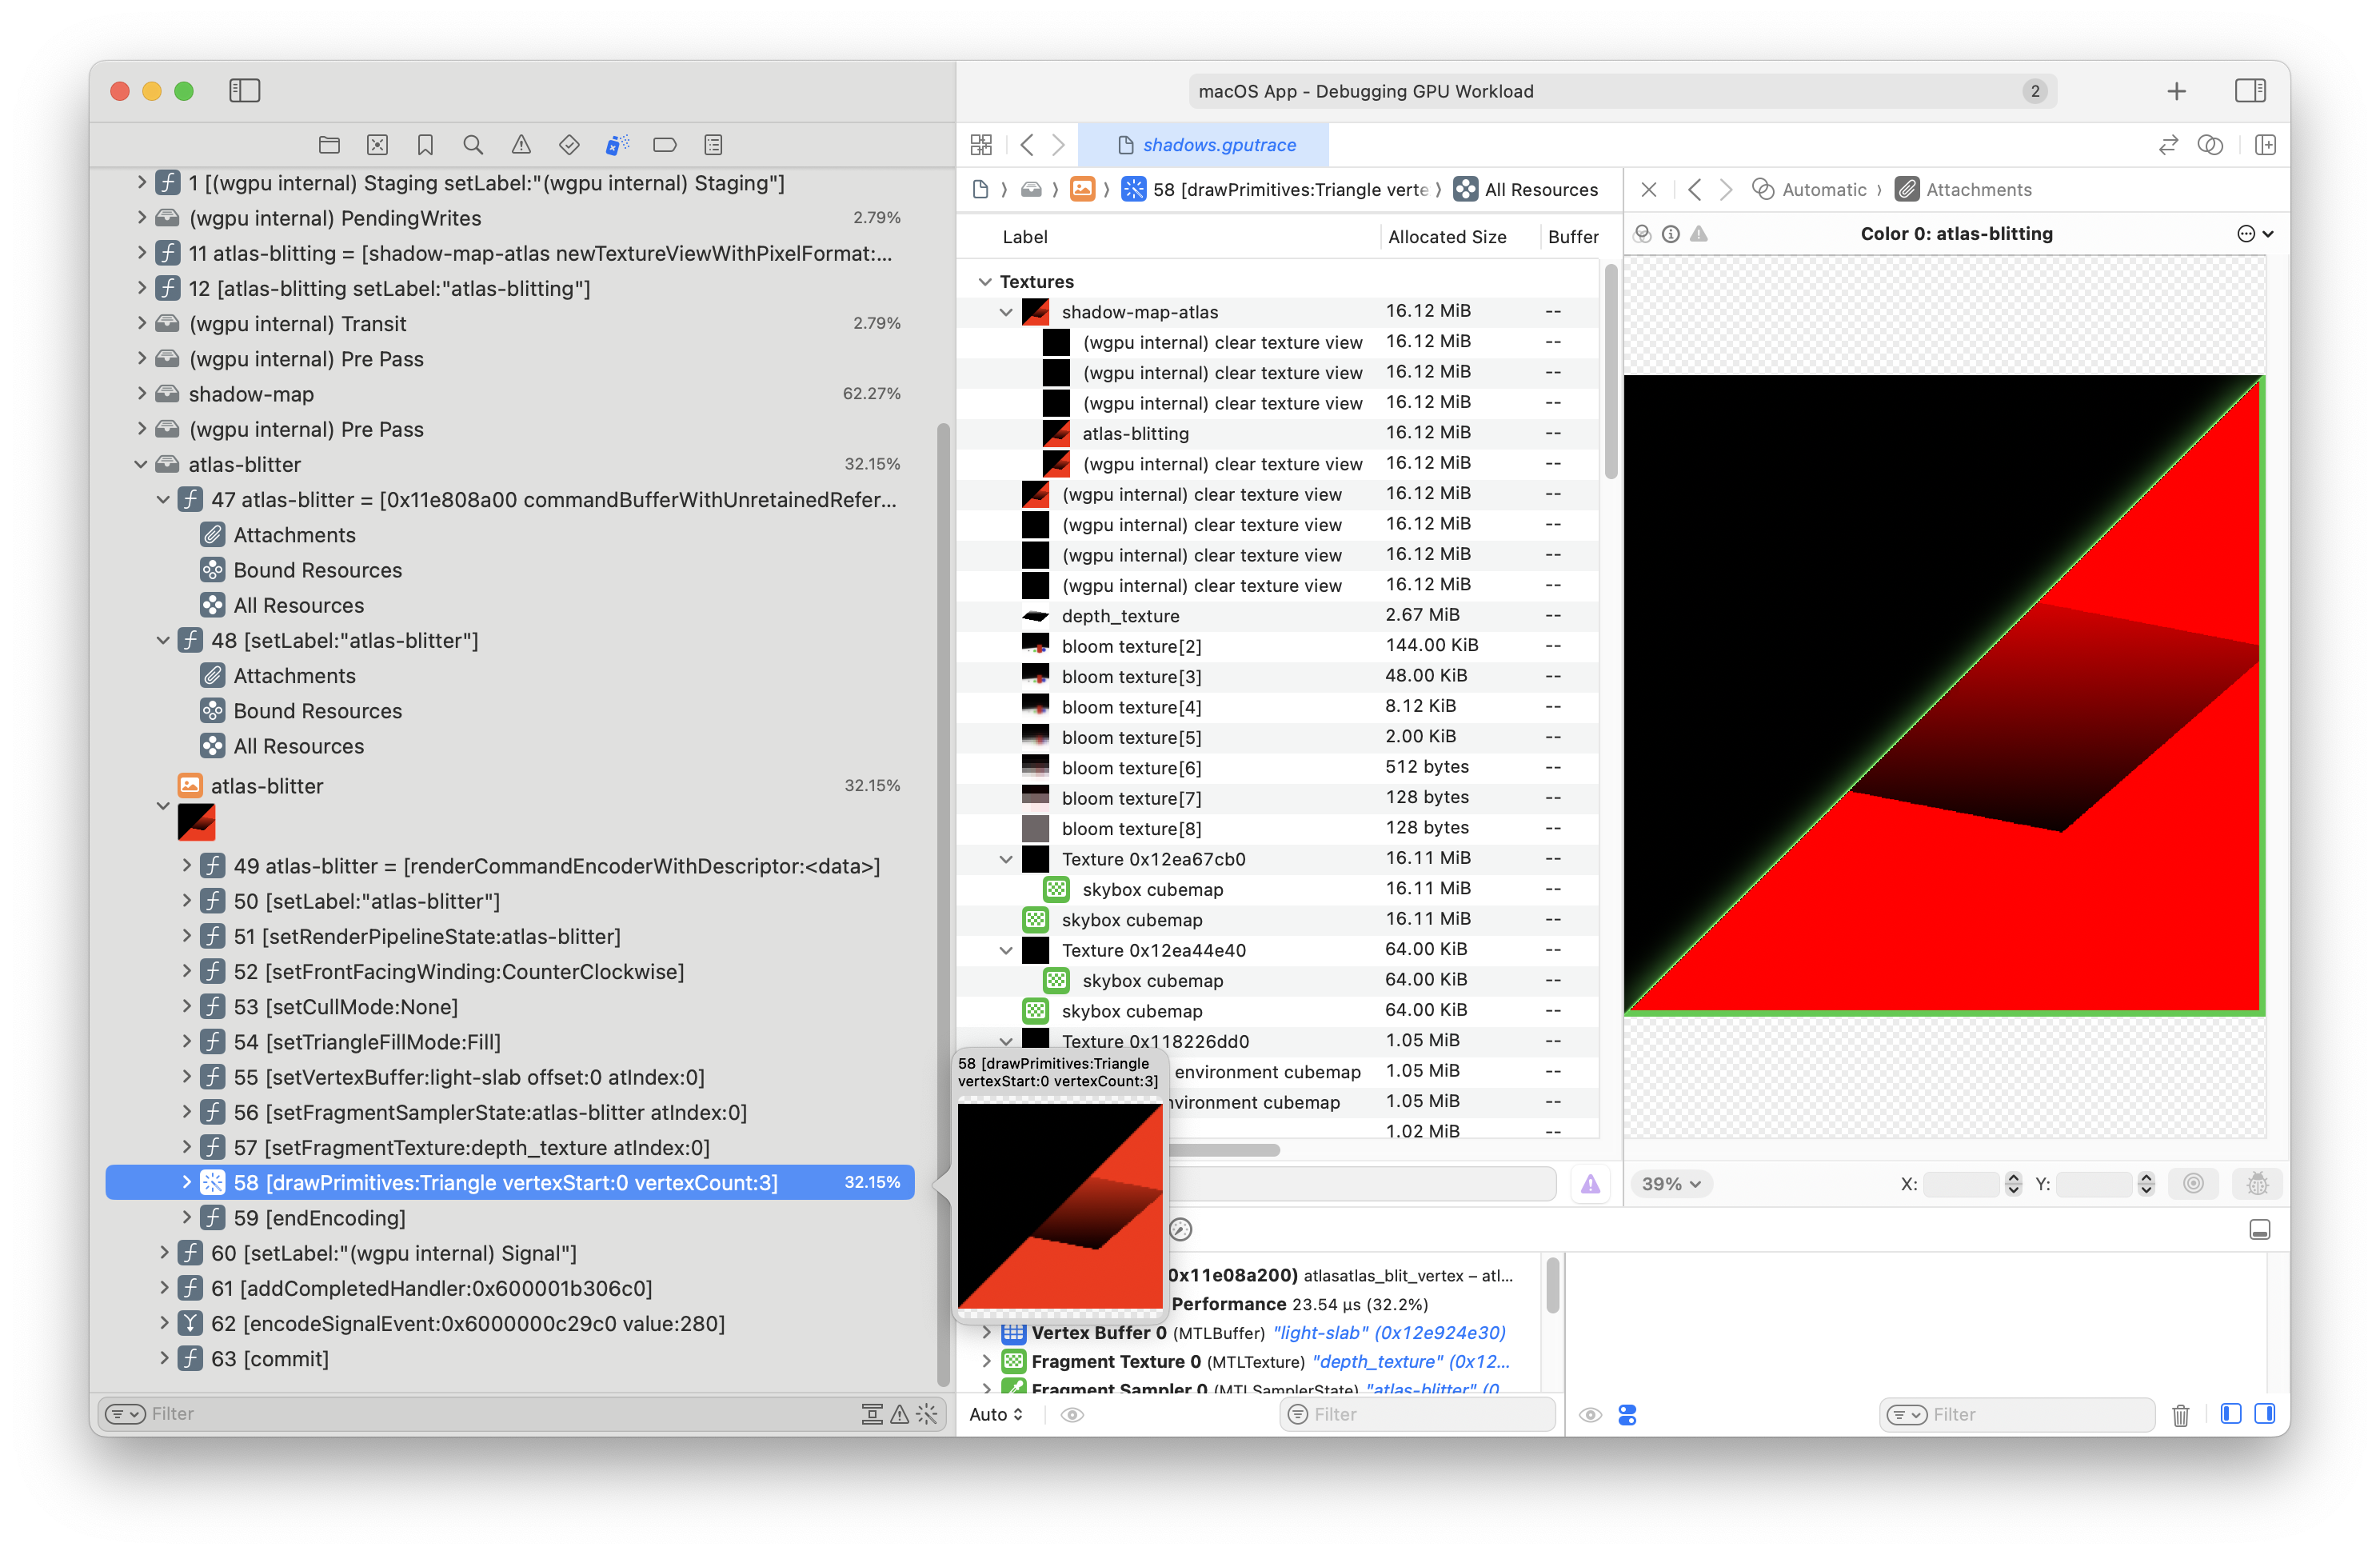
Et viola!
They still don't look great, but they are definitely functional.
Taking a closer look at just one object🔗
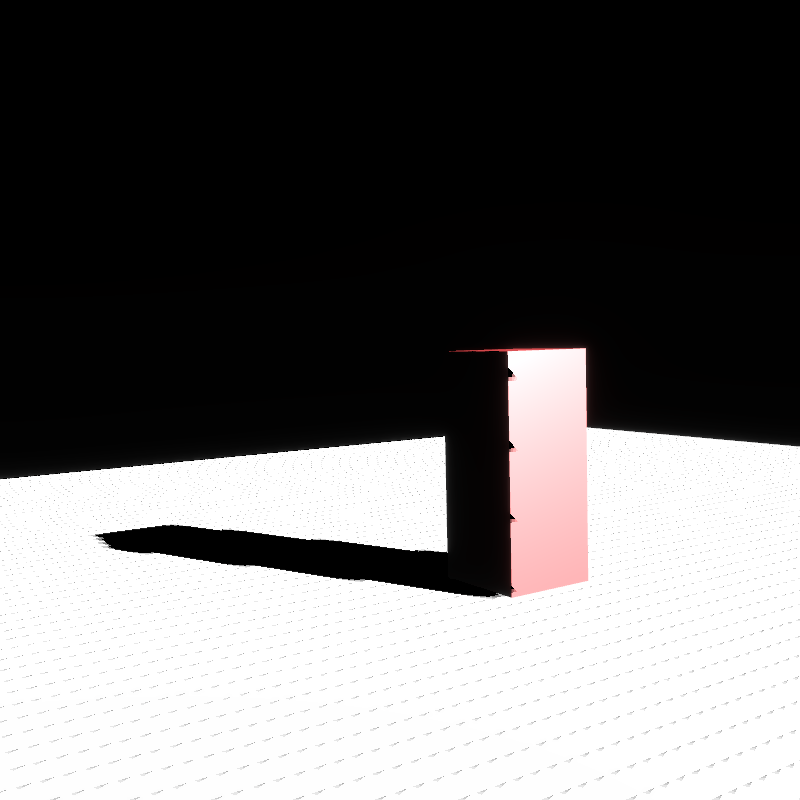
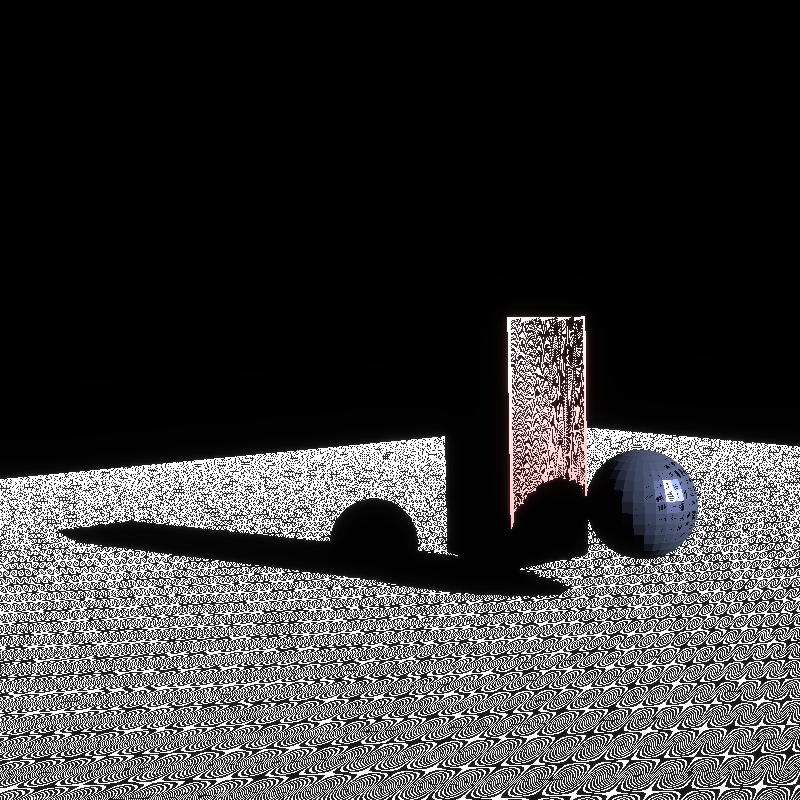
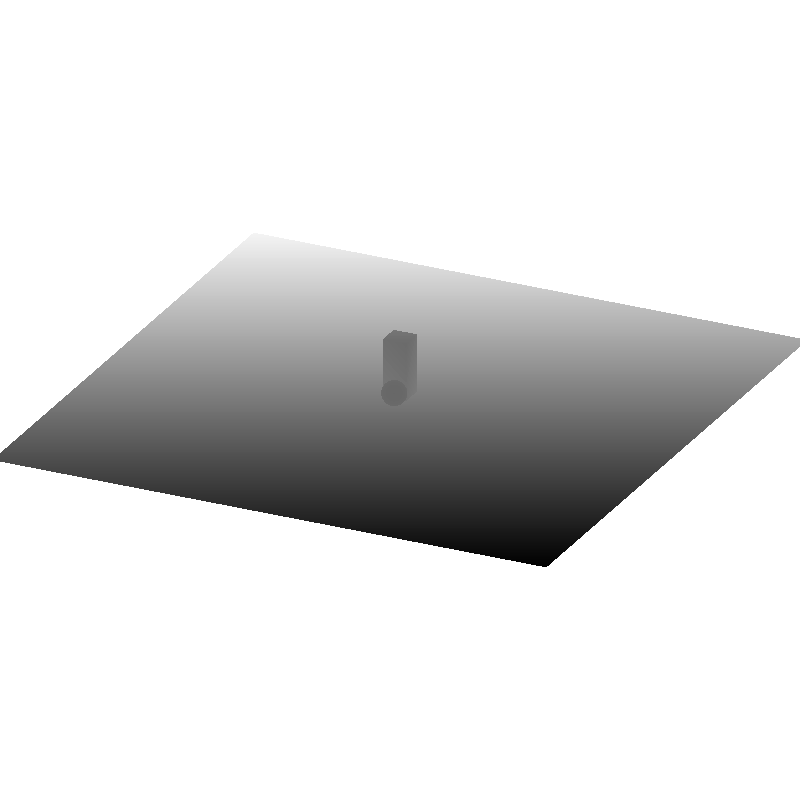
If we remove the other objects in the scene and only look at the red cuboid on the white plane, we can see that the shadow is very far away:
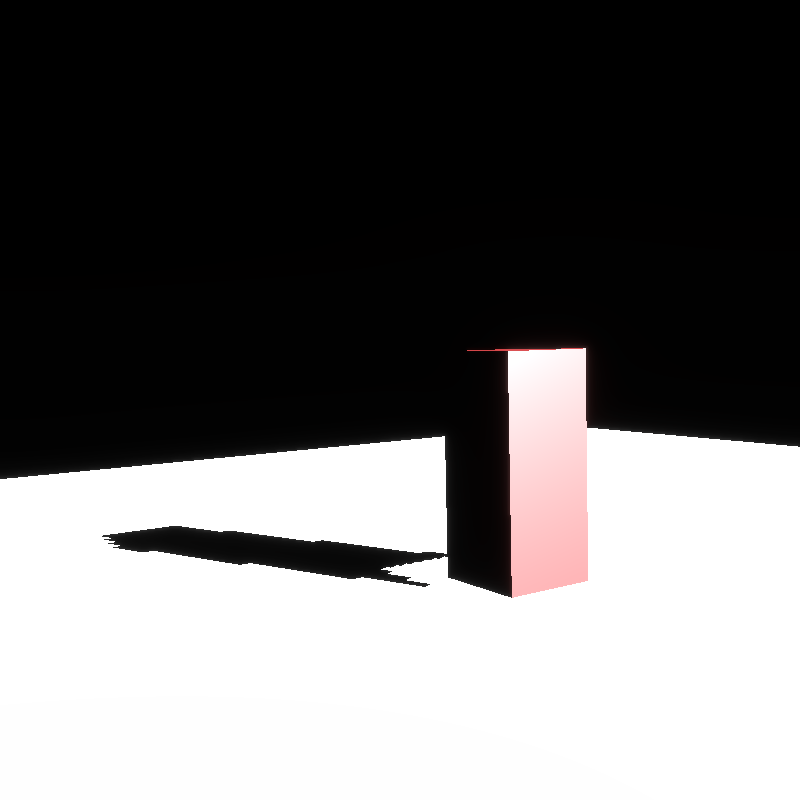
It feels like the shadow is disconnected - which we call "peter panning".
But is it actually peter panning? Or is this a product of having a relatively low-resolution shadow map?
I could imagine that since the light space transform projects the scene pretty far away from the camera, we're lacking the resolution near the edges of the shadow.
Or it could be the bias.
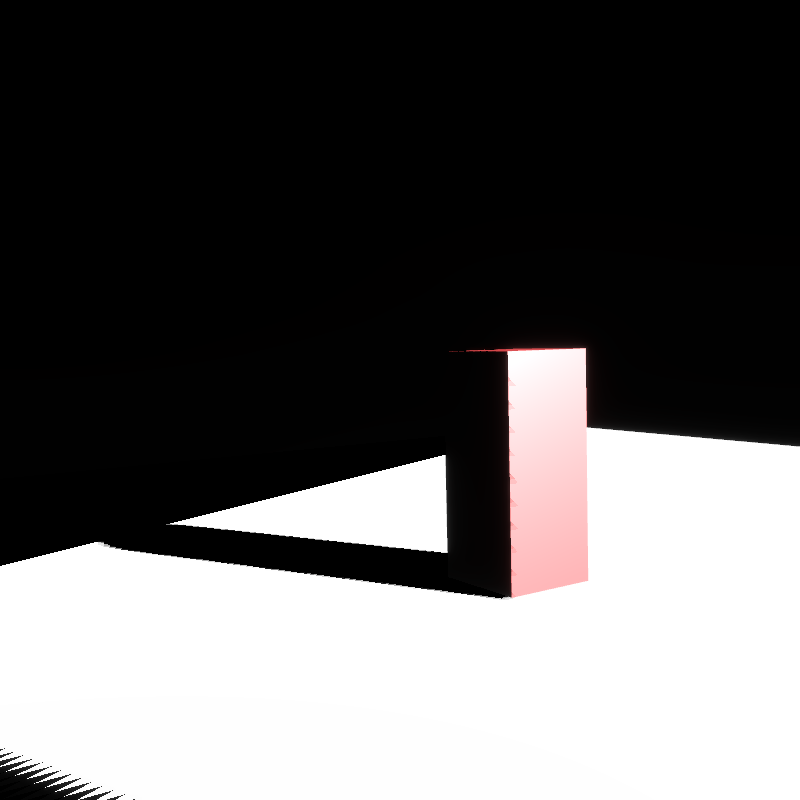
Let's rule out the bias.
...
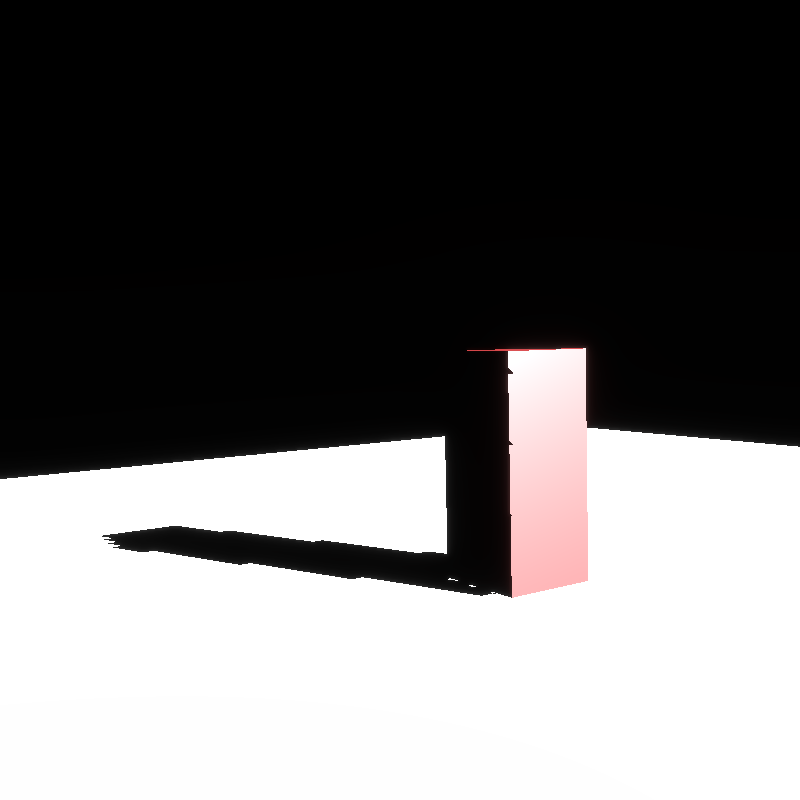
Huh, that's a lot better.
Above I set the bias_min and bias_max to 0.0.
But you can still see that there's some "artifacting", and some odd tearing on the side of the cuboid.
My guess is this is related to the resolution.
Yeah, the learnopengl article on shadow mapping talks about this in the PCF section:
Because the depth map has a fixed resolution, the depth frequently usually spans more than one fragment per texel. As a result, multiple fragments sample the same depth value from the depth map and come to the same shadow conclusions, which produces these jagged blocky edges.
You can reduce these blocky shadows by increasing the depth map resolution, or by trying to fit the light frustum as closely to the scene as possible.
Yeah, I figured as much.
But it goes on to explain PCF:
Another (partial) solution to these jagged edges is called PCF, or percentage-closer filtering, which is a term that hosts many different filtering functions that produce softer shadows, making them appear less blocky or hard. The idea is to sample more than once from the depth map, each time with slightly different texture coordinates. For each individual sample we check whether it is in shadow or not. All the sub-results are then combined and averaged and we get a nice soft looking shadow.
So let's see how easy that is. Seems like it might be a shader-only change, which I like.
...
Eh. It's kinda better.
But! Those artifacts on the side of the cuboid are worse now.
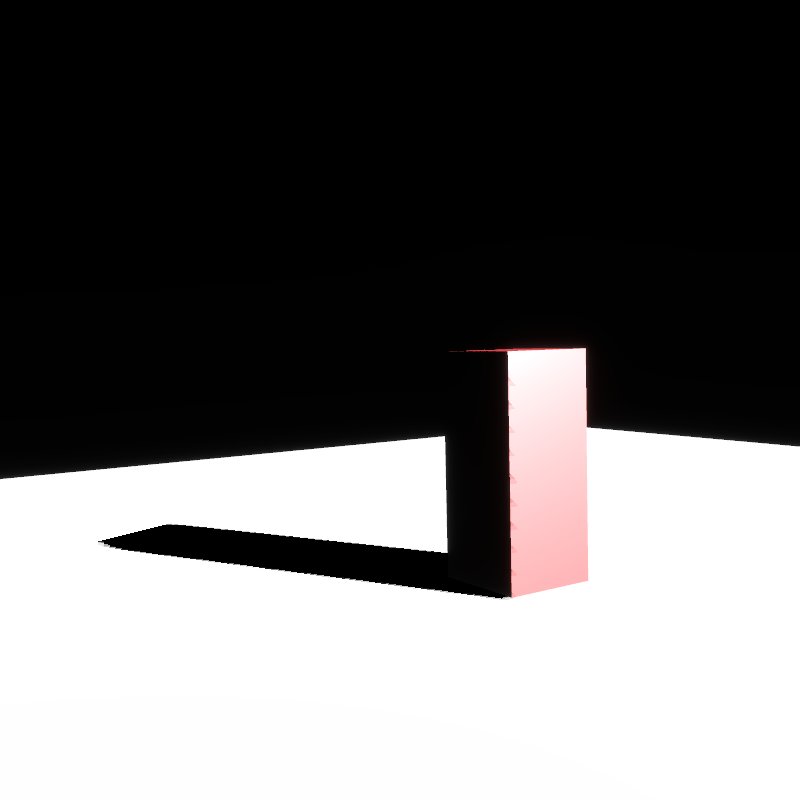
I think maybe we need to choose a better frustum.
...
Choosing a tighter depth for the light space projection improves things quite a bit,
as well as fixing a couple little finicky bugs in the shader, and also playing with
the values for min_bias and max_bias:
But check it out - you can see the borders of the shadow map now - it presents as a big jaggy line on the bottom left corner, and our plane is cut off by the ends of the shadow map to the left. This is because that area is beyond the far plane of the light space transform's frustum.
The fix for this should be easy - if the input clip coords of the fragment position in
light space is greater than 1.0 (which denotes it's outside of light space), we return
0.0 for the shadow:

That's much better! We're getting close to shipping this.
There's still that big jaggy in the lower left, though.
I'm guessing this is another border problem. We should probably check the other dimensions.
Lastly, let's use multiple shadow maps🔗
Here's the moment of truth! Let's set up a scene with more lights, that way we can see multiple shadow maps in action!
...
Aaaaaand. It's not working. The lighting is there, but the shadows are not.
Whelp! That's a wrap for now.
Sat 8 Feb, 2025🔗
Finishing up shadow mapping with multiple shadow maps🔗
I have shadow mapping with multiple shadow maps compiling. I don't have it working, though.
I'm going to debug using GPU traces.
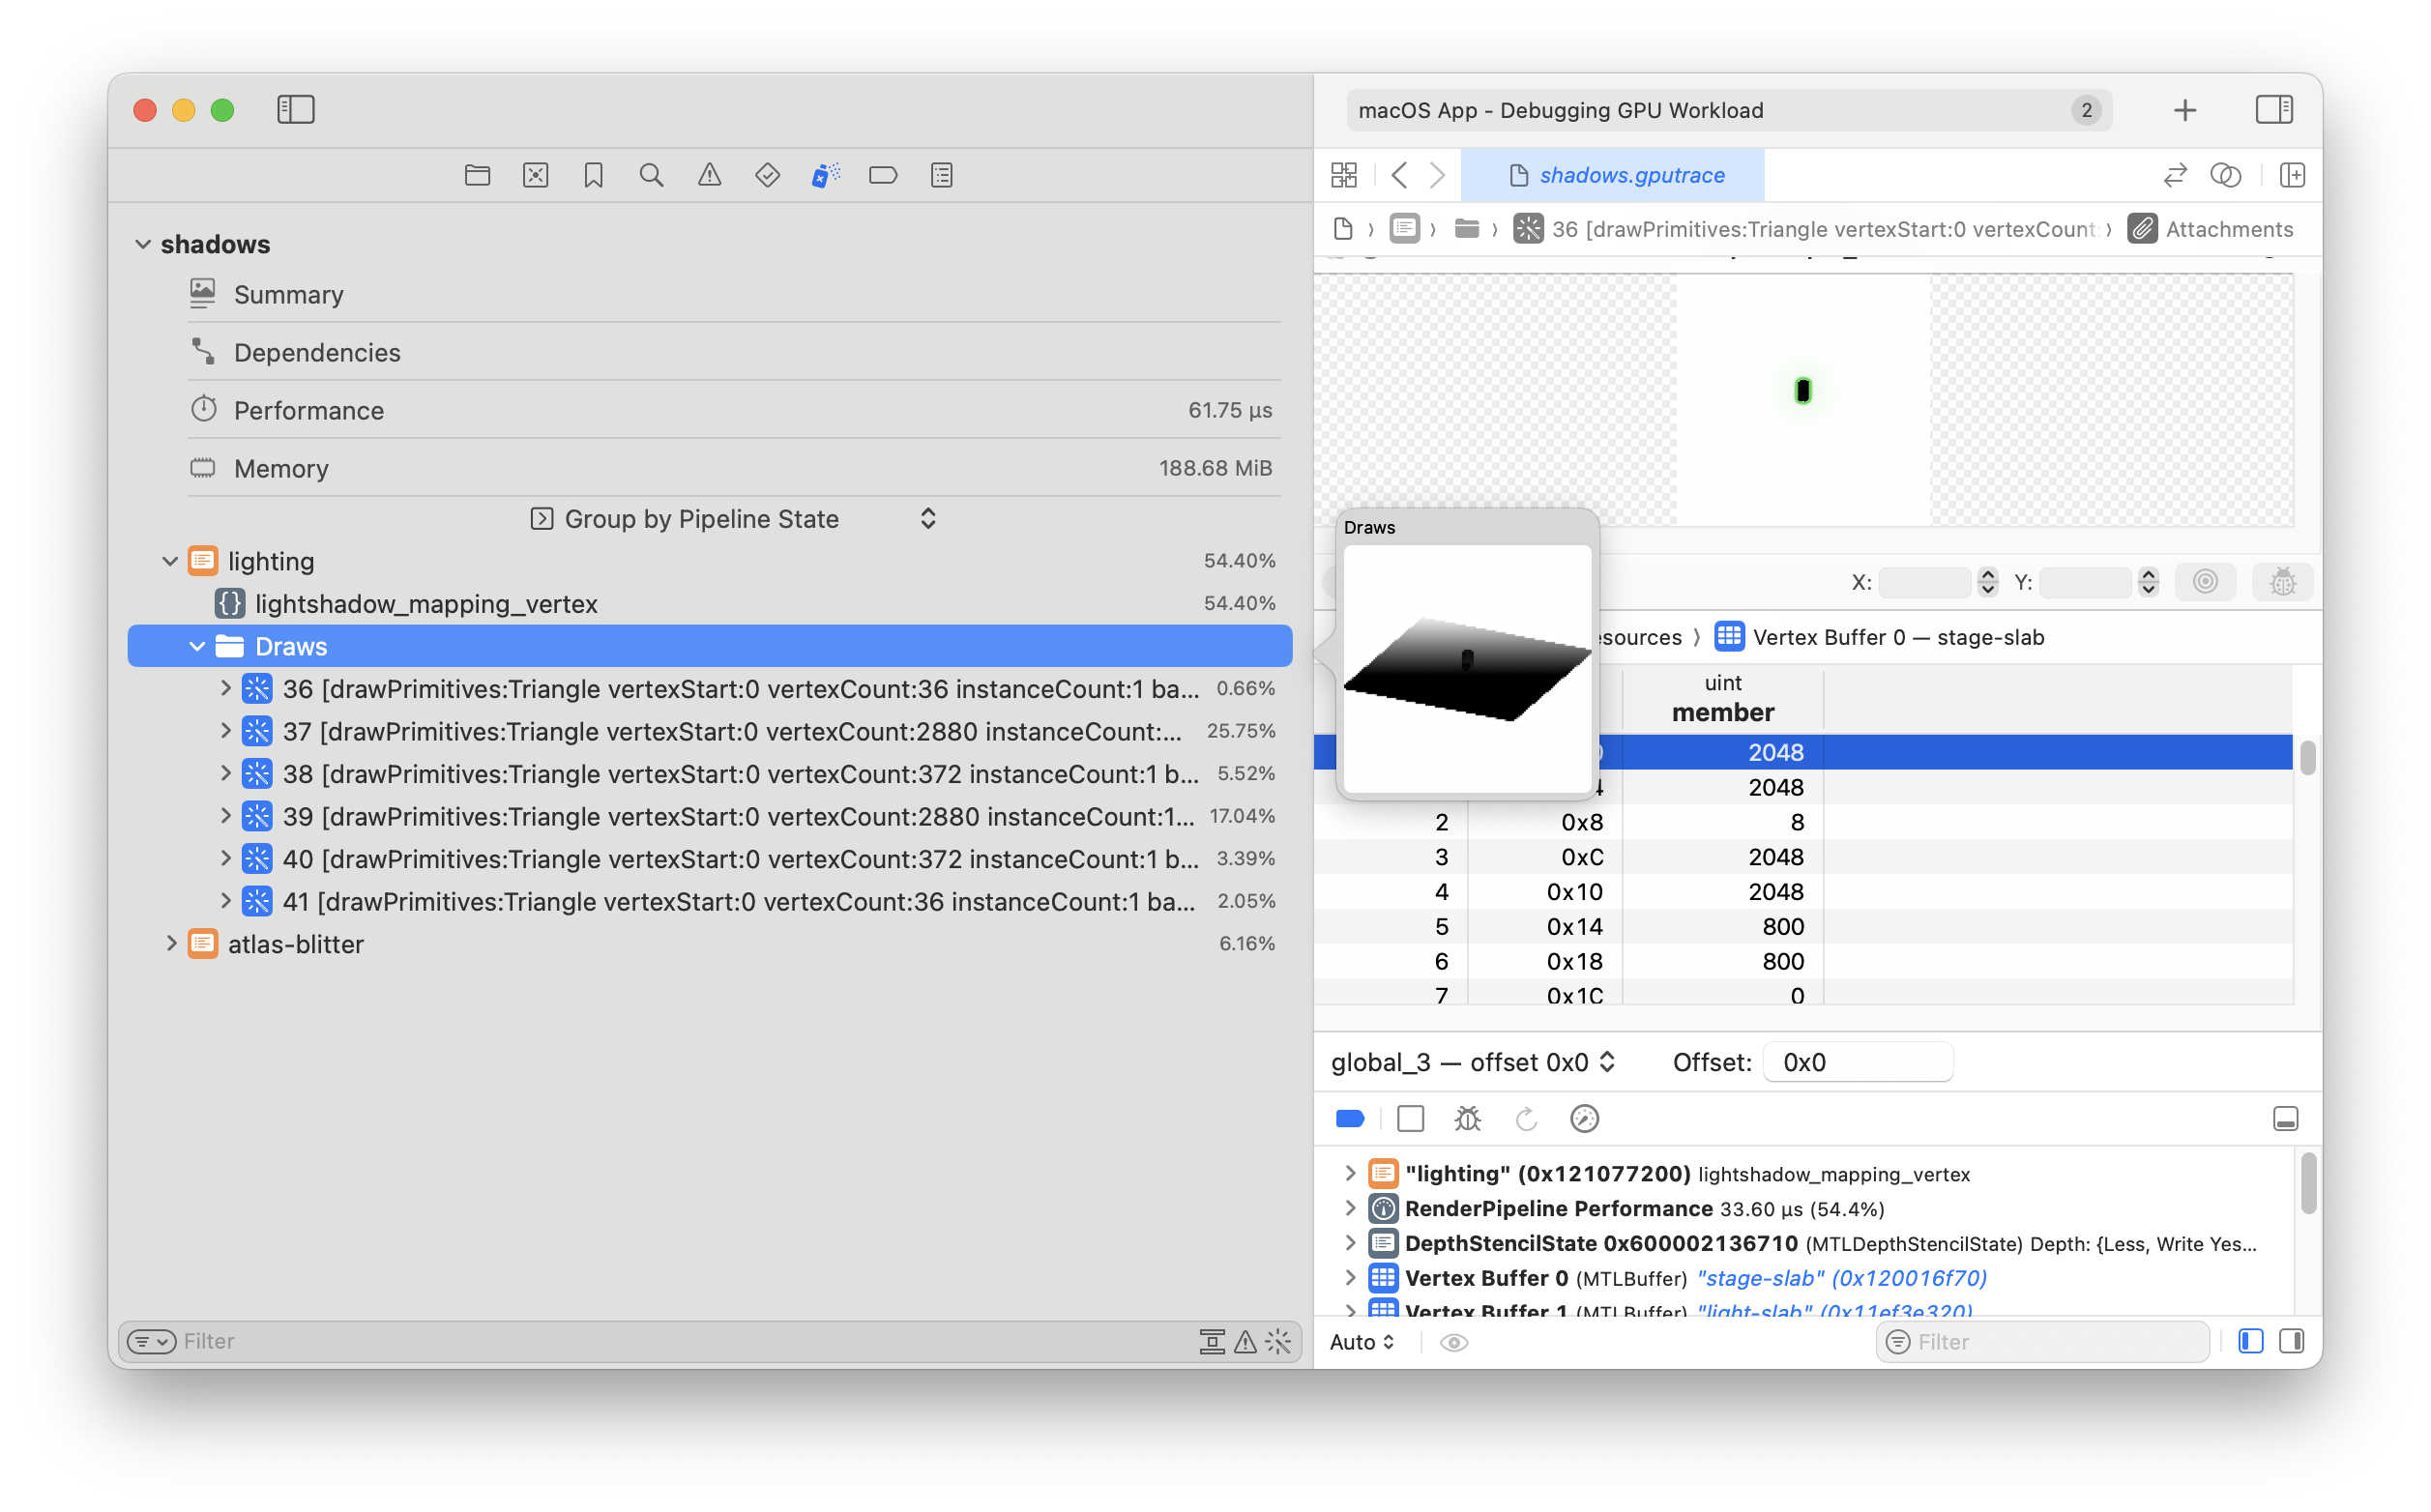
From the GPU trace file it looks like generating the shadow map depth texture is correct, but blitting it to the shadow map atlas isn't working.
The blitter includes some kind-of funky math for figuring out what clip coords to emit in the vertex shader in order to blit to the correct subsection of the atlas. I bet that's what's going on.
To make sure, I'll change the shader to blit to the entire texture...
You can already see that we're not blitting the whole frame:
But hey - this programmatic GPU tracing is really helpful.
...
Well I found (one of) the culprit(s) inside the atlas blitter:
pass.draw(0..3, 0..1);
So it's not drawing a full quad, and it's not sending over the id of the AtlasBlittingDescriptor as
the instance.
After changing those I'll check the math in the shader.
...
It's now drawing the full frame. Now I'll enable drawing to the subsection of the atlas.
...
So we're back to a fully black frame. I'll run it on the CPU and see what's up.
...
Ha! That's it. Here's the print:
atlas_blitting_desc_id: Id(39)
atlas_blitting_desc: AtlasBlittingDescriptor { atlas_texture_id: Id(null), atlas_desc_id: Id(null) }
thread 'light::cpu::test::shadow_mapping_sanity' panicked at /Users/schell/.cargo/registry/src/index.crates.io-6f17d22bba15001f/crabslab-0.6.3/src/lib.rs:39:6:
index out of bounds: the len is 63 but the index is 4294967295
All those (null) means that I simply didn't write those pointers to the slab...
...
Alright, after updating the slab correctly before each blit, I now see some funky coords.
Here's my unit test:
            // Inspect the blitting vertex
            #[derive(Default, Debug)]
            struct AtlasVertexOutput {
                out_uv: Vec2,
                out_clip_pos: Vec4,
            }
            let mut output = vec![];
            for i in 0..6 {
                let mut out = AtlasVertexOutput::default();
                crate::atlas::atlas_blit_vertex(
                    i,
                    shadows.blitting_op.desc.id(),
                    &light_slab,
                    &mut out.out_uv,
                    &mut out.out_clip_pos,
                );
                output.push(out);
            }
            panic!(
                "clip_pos: {:#?}",
                output
                    .into_iter()
                    .map(|out| out.out_clip_pos)
                    .collect::<Vec<_>>()
            );
And that outputs the following print:
clip_pos: [
    Vec4(
        -1.0,
        -1.0,
        0.5,
        1.0,
    ),
    Vec4(
        0.5625,
        -1.0,
        0.5,
        1.0,
    ),
    Vec4(
        0.5625,
        -1.0,
        0.5,
        1.0,
    ),
    Vec4(
        0.5625,
        -1.0,
        0.5,
        1.0,
    ),
    Vec4(
        -1.0,
        -1.0,
        0.5,
        1.0,
    ),
    Vec4(
        -1.0,
        -1.0,
        0.5,
        1.0,
    ),
]
Which should be "[bottom left, bottom right, top right, top right, top left, bottom left]", but it's obviously degenerate.
This is the AtlasTexture in question (the one we're blitting into):
AtlasTexture {
    offset_px: UVec2(0, 0),
    size_px: UVec2(800, 800),
    layer_index: 0,
    frame_index: 0,
    modes: TextureModes { s: ClampToEdge, t: ClampToEdge }
}
And this is the atlas descriptor:
AtlasDescriptor { size: UVec3(1024, 1024, 4) }I can pop these into a smaller unit test.
...
Turns out the conversion from clip space to texture coords was wrong.
I had this:
let input_uv = (clip_pos + Vec2::splat(1.0)) * Vec2::new(0.5, -0.5);
When what I meant was this:
let input_uv = (clip_pos * Vec2::new(1.0, -1.0) + Vec2::splat(1.0)) * Vec2::splat(0.5);
I just didn't realize I needed to flip Y first.
But wait, there's more!
It also turns out that the conversion from texture coords back to clip space was wrong!
I had:
uv * Vec2::new(2.0, 2.0) - Vec2::splat(1.0)
When what I wanted was this:
(uv * Vec2::new(2.0, 2.0) - Vec2::splat(1.0)) * Vec2::new(1.0, -1.0)
So really I guess this is the same bug but in two places. In both cases I had the "flip Y" thing wrong in one way or another.
...
WOOOOT!
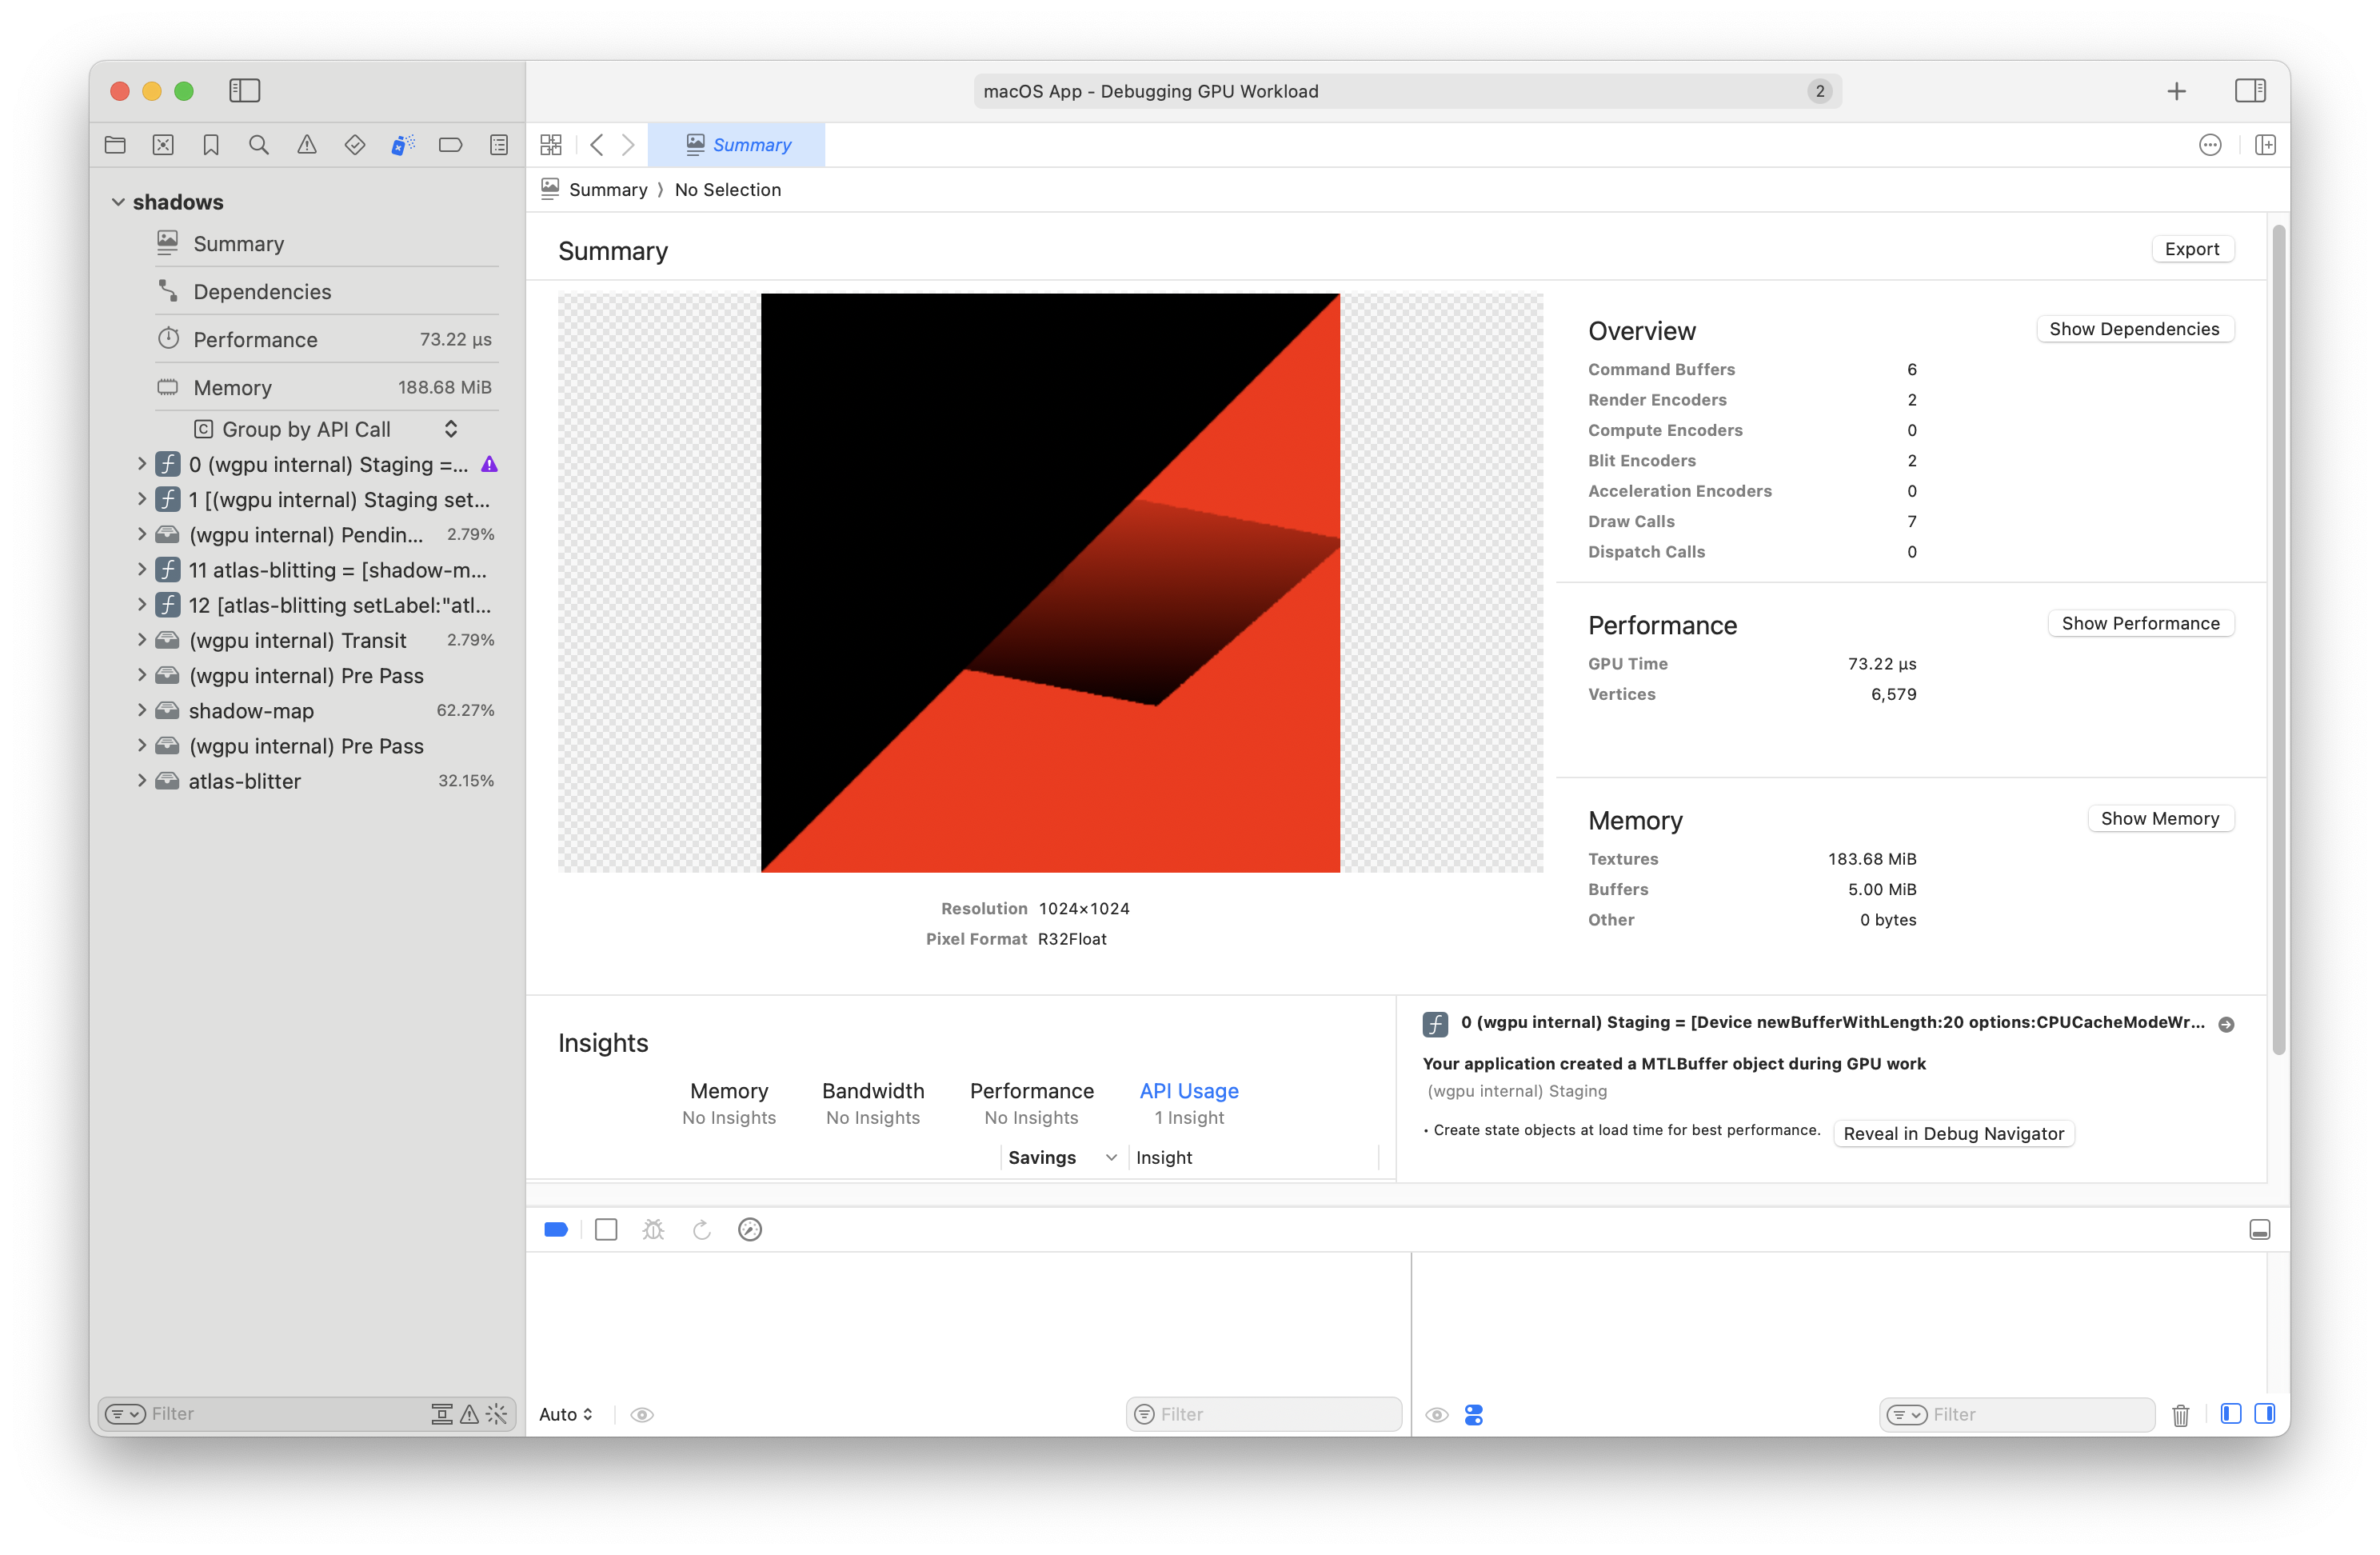
That worked. Now it looks like the shadow map atlas is populated:
...
Now, shadows are still not being rendered, but at least I know this setup is correct.
Thur 6 Feb, 2025🔗
It's Waitangi day 🇳🇿 🏝️!
craballoc now has HybridWriteGuard🔗
I added HybridWriteGuard to
craballoc.
It provides an alternative way of modifying values that might be more familiar to people.
Continuing the multiple shadow map update🔗
I'm still working on supporting multiple shadow maps per Renderlet in the forward shader.
The approach is to store the shadow maps together in a texture atlas, and to store their
descriptors on the lighting slab.
Continuing from yesterday are things to remember to circle back to:
Ensure lights and shadow maps are stored on the light slab.
Use the
AnyliticalLightBundlestruct
Store and invalidate the lighting bindgroup
It's being recreated each frame
Support configuring the
Atlas's inner texture format.Shadow maps are 32-bit depth
...
It looks like I can't copy to Depth32Float textures...
Copying to textures with format Depth32Float and aspect All is forbidden
Related WebGPU spec on depth formats.
But from the spec it looks like I can bind another texture type as the depth, though, so I can try that.
Actually it seems that it might be easier to use a separate depth texture for the shadow update, then copy that to the atlas separately.
...
UGH
Source format (Depth32Float) and destination format (R32Float) are not copy-compatible (they may only differ in srgb-ness)
Ok, so it looks like I can't even copy the depth texture.
I feel like I ran into this during occlusion culling as well. Maybe not, but similar.
...
Looks like someone made a nice TextureBlitter utility in wgpu for this.
I'll see if I can use that.
...
Turns out I can't use the built-in TextureBlitter, because I need to blit to a sub-section of the target texture,
so I'll have to write my own blitter.
Wed Feb 5, 2025🔗
Things to remember when adding support for multiple shadow maps:
Ensure lights and shadow maps are stored on the light slab.
Store and invalidate the lighting bindgroup
Tues Jan 27, 2025🔗
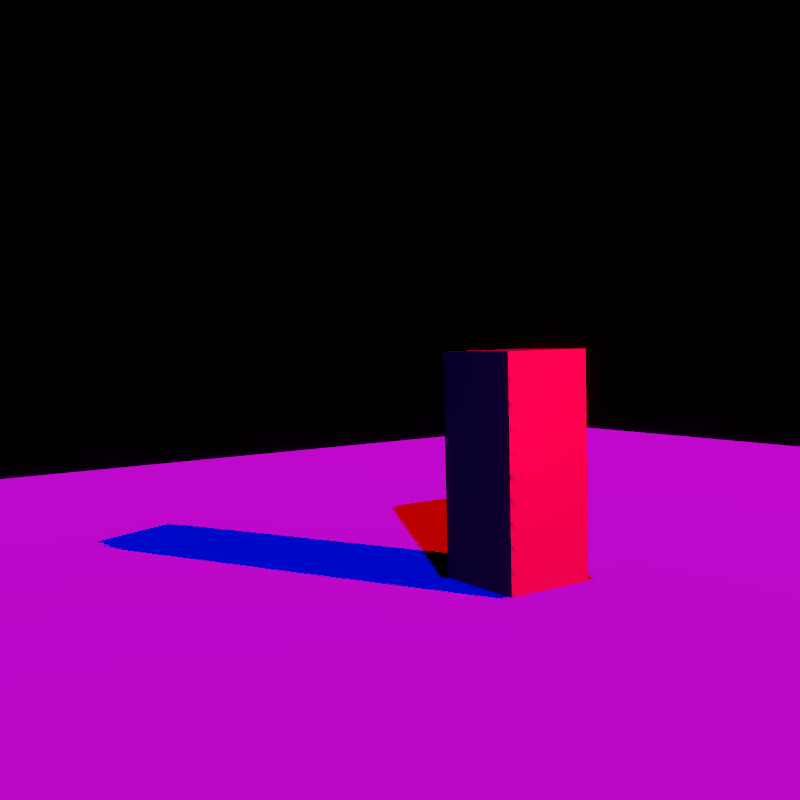
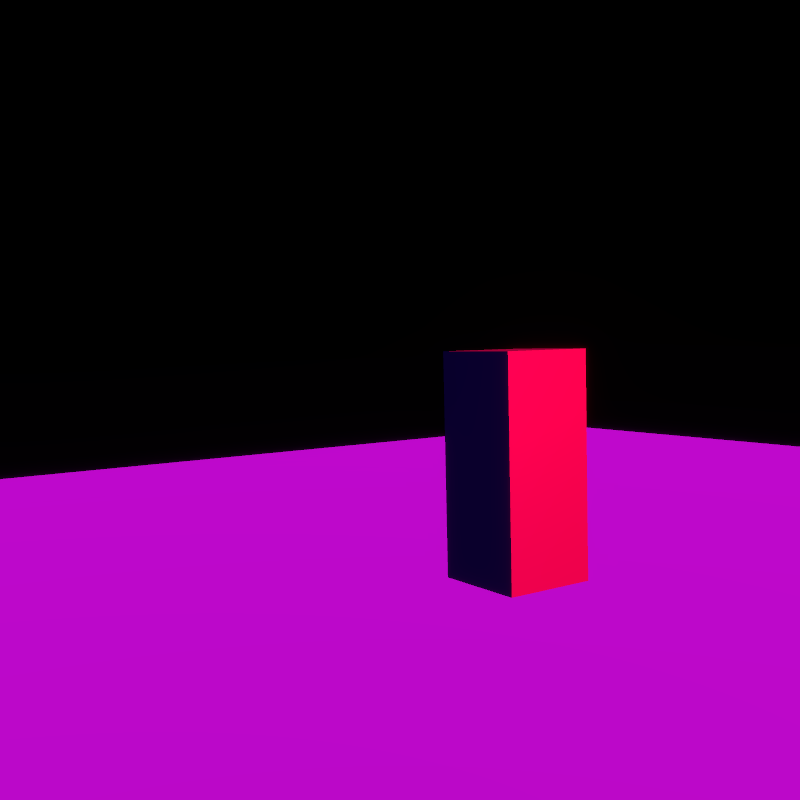
Fixing shadow mapping peter panning🔗
Yesterday I worked on addressing the shadow acne in Renderling's shadow mapping feature.
Today I'll be addressing "peter panning", which is when the shadow of an object doesn't seem to line up with the object itself - called as such because of how Peter Pan's shadow tends to misbehave in the Disney movie.
This should be relatively easy to fix by using front-face culling during the shadow map update. We'll see.
...
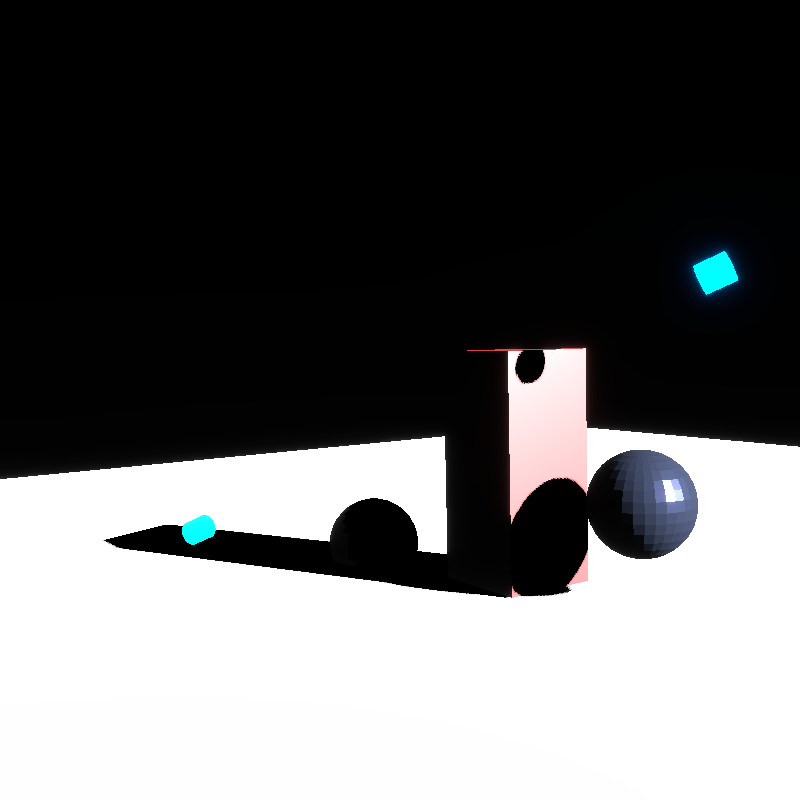
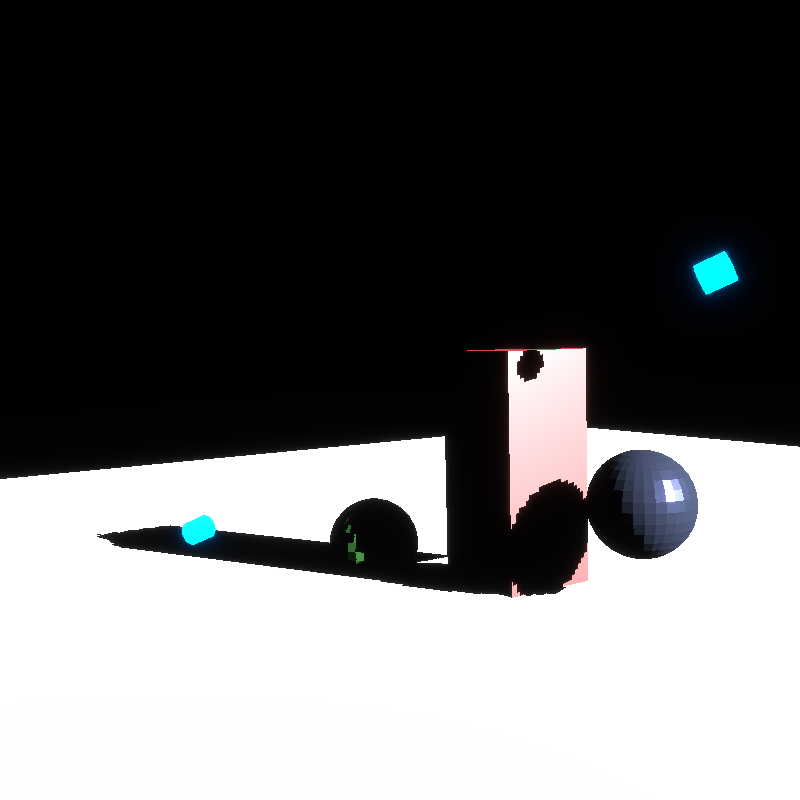
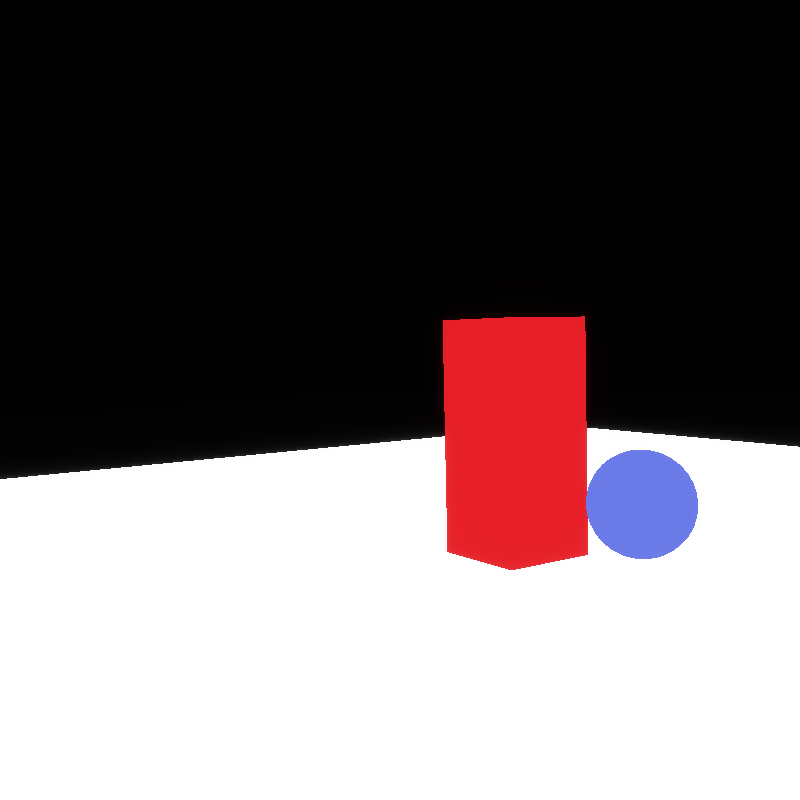
Ok! First thing - I didn't realize that the red cuboid in the scene was actually floating above the plane. So there really wasn't any peter panning going on. But I fixed it anyway.
Now at least for this scene, the bias isn't needed.
I've set the default bias to be 0.0.
I also added some emissive cylinders to show the light direction:
Mon Jan 27, 2025🔗
Fixing shadow mapping acne🔗
I left off last night being able to render some shadows, finally:
...and as you can see, there's some pretty bad "shadow acne".
Shadow acne is a Moiré-like pattern that appears when the angle between the light source and the surface is small, and that is exasperated by a small shadow map size. The smaller the size of the shadow map, the more likely to see acne.
There's a pretty easy and well known fix, which is to include a bias that is proportional to the angle.
...
After adding some configurable bias, the acne goes away:
Sun Jan 26, 2025🔗
The shadow mapping saga continues 2🔗
Yesterday I left off knowing that the PBR fragment shader's shadow calculations
seem fine, so today I'm going to look at the wgpu linkage to determine why the
shadow is not displaying.
I'm waiting for a facepalm moment and expecting that I'll find a buffer that has been invalidated or something.
...
I can't see that anything is off-kilter.
I'm going to nuke the shaders and try again.
...
Nothing.
Frustrating!
I guess I'll integrate shadow maps into the example app, capture a GPU frame in Xcode and cross my fingers that I notice something.
...
Well, that is some kind of fruitful. I can see that the shadow map depth texture is empty.
That is - it's all 1.0, everywhere.
The only place it gets cleared is in the ShadowMap::update function.
...
I was able to capture a GPU frame programmatically using this function:
    pub fn capture_gpu_frame<T>(ctx: &Context, f: impl FnOnce() -> T) -> T {
        let m = metal::CaptureManager::shared();
        let desc = metal::CaptureDescriptor::new();

        desc.set_destination(metal::MTLCaptureDestination::GpuTraceDocument);
        desc.set_output_url(workspace_dir().join("test_output").join("capture.gputrace"));
        unsafe {
            ctx.get_device()
                .as_hal::<wgpu_core::api::Metal, _, ()>(|maybe_metal_device| {
                    if let Some(metal_device) = maybe_metal_device {
                        desc.set_capture_device(
                            metal_device.raw_device().try_lock().unwrap().as_ref(),
                        );
                    } else {
                        panic!("not a capturable device")
                    }
                })
        };
        m.start_capture(&desc).unwrap();
        let t = f();
        m.stop_capture();
        t
    }
And with the gputrace I can clearly see that the shadow map is being created correctly and it has the value I expect at the point I expect.
This programmatic capture is a game changer!
Since the shadow map depth texture is fine, it could be one of two things:
sampling the texture is somehow borked
the calculation of finding the uv coordinates used to sample is borked
To disprove 2 I'll rewrite the fragment shader to write these coords as the color.
It should show roughly the fragment's distance from the light source, where darker
means closer.
Hrm. It's all black, with no shading at all. This could mean that the fragment position in light clip-space is being miscalculated.
...
I think I've tracked it down to this line:
let light_space_transform = light_slab.read_unchecked(lighting_desc.shadow_map_light_transform);
It seems that line is causing the shader to crash.
This can happen, as the name of that function suggests, Slab::read_unchecked doesn't check the
given Id to see if it's Id::NONE, which is u32::MAX. So trying to read with that index would
predictably crash.
So if lighting_desc.shadow_map_light_transform is Id::NONE, that means it hasn't been updated
since updating the shadow map.
...
With the new capture functionality I should be able to read the value of the Id.
...aaaaand yup! I can see there are 3 light-slab buffers and two of them are only 4 bytes!
Those 4 bytes correspond to the Id::NONE value written as the pointer to the shadow mapping
light transform.
Now I just need to figure out why there are so many light slabs here.
...OOF! 🤦
Looks like Stage creates its own Lighting object, which contains the lighting-slab, then in
render_with (a temporary function just for fleshing out this feature) binds that slab, not
the one used by the external ShadowMap.
Finally, rendered shadows🔗
Let's stop here for now.
Sat Jan 25, 2025🔗
The shadow mapping saga continues🔗
I've hooked up shadow mapping end to end. Everything is connected. The shadow map looks good, so why isn't anything happening in my PBR shader?
Well it's because my test has lighting turned off. lol 🤦. This is why I keep the facepalm emoji close at hand.
...
Ok - even after that it looks like my analytical lighting is borked.
The scene_cube_directional test, which tests directional lighting, is failing.
I'll have to fix that test before continuing.
...
Ok - it was because my shader was doing something stupid. I had changed the shader
for debugging purposes to calculate the color as shadow * everything_else, and
since shadow is 0.0 when there is no shadow everything was coming up dark.
After updating the shader (returning it to normal, without shadows) it works as expected.
...
So now let's look at the scene with analytical lighting to ensure the directional light is working.
It's working.
...
Fixing the lighting calculation shows that the shadow has no effect, meaning it's returning 0.0 everywhere.
No shadow.
So I'll run the calculation on the CPU over each fragment position and look at the generated images.
...
That's tough, because I'd have to save the world positions of each fragment to a GBuffer and read it.
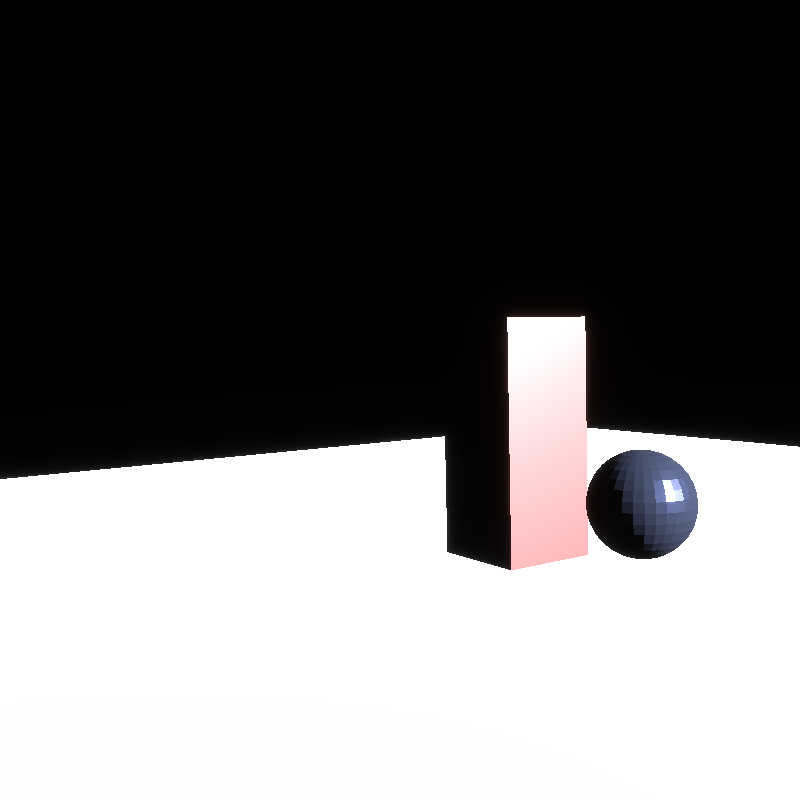
Instead, I've placed another object in the scene which should be in the shadow of the block.
I know its position and so I can calculate the shadow at that position and it should come out to 1.0.
Ok, I can see that the conversion of the fragment position in light space to the shadow mapping
sampling coordinates is incorrect.
This code, coming from learnopengl.com is assuming the OpenGL projection matrix which assumes
a depth range of -1.0 to 1.0 and it also assumes that the texture space origin is the lower
left corner.
After correcting for that, the sampling coords in pixels become 406.20013, 363.07574, which seems
right on the money if you look at the depth image.
But now it looks like the closest depth at that point (the sample) is coming up 1.0, 1.0, 1.0, 1.0,
which would be at the very back of clip space, which is wrong, it should be coming up somewhere in the
middle - so 0.5.
So I think my CPU sampling is off.
Yup! It is. I've now improved CPU sampling a bit.
And now the test passes that assertion - turns out it was indeed the transformation of the frag position in light space into the sampling coordinate.
...
But I'm still not seeing a shadow.
That could mean that there's something wrong further up in the shader. It could also mean that the bindings are not set up correctly.
...
I hadn't updated the PBR fragment shader to read the shadow mapping light transform from the descriptor. We'll see if that helps (it should).
...
That didn't seem to do it. There must be more items on the bug stack.
...
So I'm now trying to find values to run the fragment shader with, and it's really making me feel like the fragment shader should be writing to a g-buffer. That would make this debugging a lot easier. Of course, it's not easier to write that g-buffer code and do the debugging. But that's another thing I should put on my list...
...
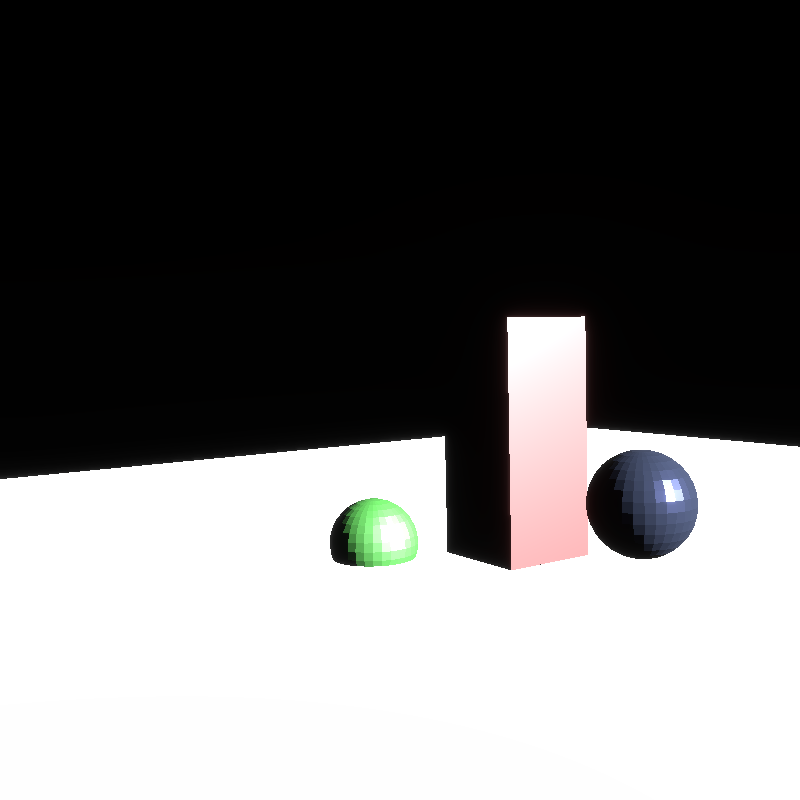
After getting the vertex info from the point on the top of the green sphere and running the
fragment shader with that, it looks like the value being returned from shadow_calculation
is 1.0, which is what I expect.
That point is indeed in shadow.
So then that leaves CPU side things, I think.
I'll take a look at the wgpu linkage.
Mon Jan 20, 2025🔗
I'm starting to think I should separate the buffers by concern.
With wgpu's "downlevel default" resource limits we're limited to 4 bind groups
per shader stage.
I think I could split Renderling's main bindgroups into (roughly):
Geometry slab (vertex, index, bounding volumes etc)
Material slab and atlas (textures descriptors from the atlas, material descriptors)
Lighting slab (lights, shadow maps)
...
And now that I think of it, I could use an Atlas to store shadow mapping texture data.
This would allow sampling from actual textures, as opposed to the current situation where
if I want more than one shadow map I'd have to copy the depth texture to a storage buffer.
When using Atlas, the textures would be stored in a
texture array, which means we could have more than one, and at different sizes - and which
would negate the separate compute step!
One complication I see is that point light shadow maps use cube maps, and sampling from our atlas doesn't yet support cube map sampling, so I'll have to write that.
But actually - if I wrote support for cube map sampling from the Atlas, I could store the
skybox and IBL data in the same way! This would really save on texture bindings and clean
up the shaders.
Sat Jan 18, 2025🔗
Back to shadow mapping.
The aformentioned craballoc part-out session
sparked some bug fixes to scheduling and improvements to the
CPU/GPU synchronization API.
This in turn, I think, fixed the shadow mapping problem I was seeing before,
where the shadow map's depth texture only showed a sliver of data.
It seems we have perfect data on the GPU and can move on:

So now that we have the shadow mapping depth values, we should be able to use it in the PBR shader.
How to bind the shadow map?🔗
The most common method to bind the shadow map to the PBR shader is to assume there's only one, and bind the depth texture as a sampling source.
But this limits us to one shadow source. That's not what renderling is about.
It would be nice to bind an array of shadow map depth textures, and then index into it, but WebGPU doesn't support arrays of textures.
So I have to think about copying the depth buffer to a storage buffer (possibly just for lights) which I could then "sample" from, since WebGPU doesn't provide arrays of textures to bind to.
So I have to choose:
set the number of shadow maps statically at compile time with a descriptor set and binding.
run shading once per shadow map (I don't know how that would work)
use a texture array of shadow map depths and each shadow map is the same size
use a compute pass to copy the depth to a storage buffer and index into it to sample
With a storage buffer for lights we could store the shadow map's depth buffer at any size, and reference it from the slab.
But we would lose sampling conveniences.
...
For now I'm just going to bind one shadow map statically. I can worry about this later after I've proven the rest of the method.
Sun 12 Jan, 2025🔗
I wrote a 2024 wrapped article. Check it out!
Parted out SlabAllocator🔗
I also parted out the SlabAllocator from renderling into its own crate, now called
craballoc. I'm now using it for other GPU projects.
LA fires🔗
I also worked on a short article on the LA fires, as I'm from Pasadena and have friends and family living in Altadena. I'm not sure if I'll publish it, or if I do I might not publish it here. It might make more sense to host it at my personal site zyghost.com.
Either way, my heart goes out to everyone there. We left California because of these fire events and although I think it was the "right" decision for our family, it's not so easy for others to take that leap.
Bug fixes🔗
I'm currently babysitting a bug fix through CI:
nlnet contract updates🔗
I re-read my contract with NLNet and it looks like I actually have until May 10th, 2025 to complete my work!
This means I can likely complete shadow mapping and at least start tackling light tiling and be paid for it!
Fri 27 Dec, 2024🔗
Shadow mapping debugging session 3🔗
Xcode debugging doesn't seem to reveal anything interesting.
Now I'll bind a render attachment to the shadow map update and see what happens.
Thu 26 Dec, 2024🔗
I hope you all are having a great holiday break!
Shadow mapping debugging session 2🔗
Welcome to another installment of debugging the shadow mapping shader.
I'm going to collect and compare the world position as calculated from the vertex shader and from the shadow mapping shader.
...⏱️
Ok, those are all the same! Well, that's good, I guess.
This means the bug is after calculating world position. I'll just go along and assert some things.
The light's id is correct.
All the renderlet's camera_id fields are set to the correct camera.
And the light we're using is the one we expect to use.
And the light's parent transform is what we expect.
The cameras used to calculate shadow_mapping_projection_and_view, which is
the light transform - are what we expect.
The light transforms themselves are also what we expect.
In the test case we're taking the light_projection and light_view as
calculated by DirectionalLight::shadow_mapping_projection_and_view.
We've already asserted that the results are what we expect.
The calculated world positions for each vertex are equal.
All the calculated values, including the resulting view+projection matrices are the same...
...
I'll wire this into an app and then use Xcode debugging tools... ...oof.
Mon 23 Dec, 2024🔗
Shadow mapping debugging session 1🔗
I'm working on shadow mapping, hoping to finish it up before the end of the year so I can claim another milestone on my grant project. If I can manage it, it would mean I hit 6/7 of the milestones - only missing light tiling, which I will carry over into the new year (with funding or not).
Currently, I've got a separate depth texture used as the shadow map, I've calculated the light transform that shows the scene from the light's point of view, and I'm rendering with my usual rendering pathway but using the light transform as the camera to verify that transformation.
This is what I see:

The problem is that when I apply this transformation to shadow mapping, the depth appears completely black.
This is a classic example of how things go wrong in a graphics project, lol.
I have a feeling it's rendering, but it's all black because depth in NDC is not linear - the resolution decreases the further from the camera you are.
...⏱️
Hrm. Even after linearization and normalization, nothing.
The depth texture is all zero. Maybe it's being cleared?
...⏱️
Ok, so it looks like some of the historical tests that assert depth are broken. So somewhere along the line of these changes I broke the depth buffer.
Time for a git bisect.
git bisect says it was commit
19c6db194b7ce8afa129b9d88fbe3c1542e5b3f0,
which is a giant checkpoint commit. I often do checkpoints in WIPs because I'm
frantically coding in my free time and get interrupted and lose context on what
I was working on.
This devlog is an attempt to allay that problem, really.
It could be the change here https://github.com/schell/renderling/pull/145/commits/19c6db194b7ce8afa129b9d88fbe3c1542e5b3f0#diff-07be3c3837d7379336a0625534f3c01c4a8c7870d14037b351555aeed2e97670L683-R689.
...⏱️
Well, that was one problem, but another problem is that the depth of the light transform's frustum is coming out very small.
...⏱️
After the fixing the mistake above, if I don't linearize the depth, the depth texture is fine. So for the sake of finishing this milestone I'm going to log a warning and make a TODO to fix depth linearization and move on.
Now - I've been doing this in a regular Stage rendering in order to verify
the light transform.
That's done, so now I can "update" the shadow map and I should see the same
depth texture.
But my shadow map's depth texture is blank.
There's probably something wrong with the pipeline setup, or with the shadow
map's vertex shader.
I'll start by debugging the vertex shader.
Here is the function's signature:
/// Shadow mapping vertex shader.
#[spirv(vertex)]
#[allow(clippy::too_many_arguments)]
pub fn shadow_mapping_vertex(
    // Points at a `Renderlet`
    #[spirv(instance_index)] renderlet_id: Id<Renderlet>,
    // Which vertex within the renderlet are we rendering
    #[spirv(vertex_index)] vertex_index: u32,
    #[spirv(storage_buffer, descriptor_set = 0, binding = 0)] slab: &[u32],
    #[spirv(storage_buffer, descriptor_set = 0, binding = 1)] light_id: &Id<Light>,

    #[spirv(position)] out_clip_pos: &mut Vec4,
) {...}
So first I'll get the slab and I'll run the vertex shader on the CPU to see if we get any NaN values or something of that ilk:
        let slab = futures_lite::future::block_on(stage.read(&ctx, None, ..)).unwrap();
        let mut clip_positions = vec![];
        for hybrid in doc.renderlets.values().flatten() {
            let renderlet = hybrid.get();
            for index in 0..renderlet.get_vertex_count() {
                let mut out_clip_pos = Vec4::ZERO;
                crate::light::shadow_mapping_vertex(
                    hybrid.id(),
                    index,
                    &slab,
                    &gltf_light.light.id(),
                    &mut out_clip_pos,
                );
                clip_positions.push(out_clip_pos);
            }
        }
        log::info!("clip_positions: {clip_positions:#?}");
Hrm. No NaNs, I see a lot of values like this:
        Vec4(
            0.0072851786,
            -0.0029473465,
            6.3410006,
            1.0,
        ),
        Vec4(
            -0.17068025,
            -0.21936357,
            9.806452,
            1.0,
        ),
        Vec4(
            0.17068014,
            -0.48623937,
            5.5299783,
            1.0,
        ),
        Vec4(
            0.17068014,
            0.21936369,
            3.5116858,
            1.0,
        ),
        Vec4(
            -0.17068025,
            -0.21936357,
            9.806452,
            1.0,
        ),
        Vec4(
            0.17068014,
            0.21936369,
            3.5116858,
            1.0,
        ),
        Vec4(
            -0.17068025,
            0.4862395,
            7.78816,
            1.0,
        ),
Curious though, as these values don't seem to be in clip space? I wonder how many vertices are in clip space?
I'll do:
    let ndc = out_clip_pos.xyz() / out_clip_pos.w;
    if ndc.distance(Vec3::ZERO) <= 1.0 {
        clip_positions.push(out_clip_pos);
    }
Huh! Zero positions are in clip space. So that's a problem.
...
I'm thinking this is probably because in my verification of the light transform I'm only transforming the input vertices by the light transformation, whereas in the shadow mapping vertex shader I'm transforming the input vertices into world space and then transforming that again by the light transformation. So I'm simply not done with the build-out of this vertex shader. This is the cost of losing context between development sessions.
It turns out I simply had not used the same function for determining the light transform in my shader.
...
Ok, it also turns out that for the step where I verify the light transformation, I was changing all the renderlet's camera ids to a new one based on the light's POV - but I forgot to change them back! So many bugs on top of each other. Ok, now that I have that sorted I can see something in my depth, but it's hardly anything:
From the numbers it looks like the transformations are correct, and I can't find an obvious discrepancy between the shadow mapping vertex shader and the normal vertex shader. I'll take a look at the pipeline set up and see if there's anything obvious there that I missed. I think as a last resort I could use a pass-through fragment shader to try to "see more".
The fact that I can see this sliver, though, makes me think there's still a problem with clip space. Somehow most of the scene is getting clipped in the shadow mapping vertex.
I'll have to spend another day debugging this...
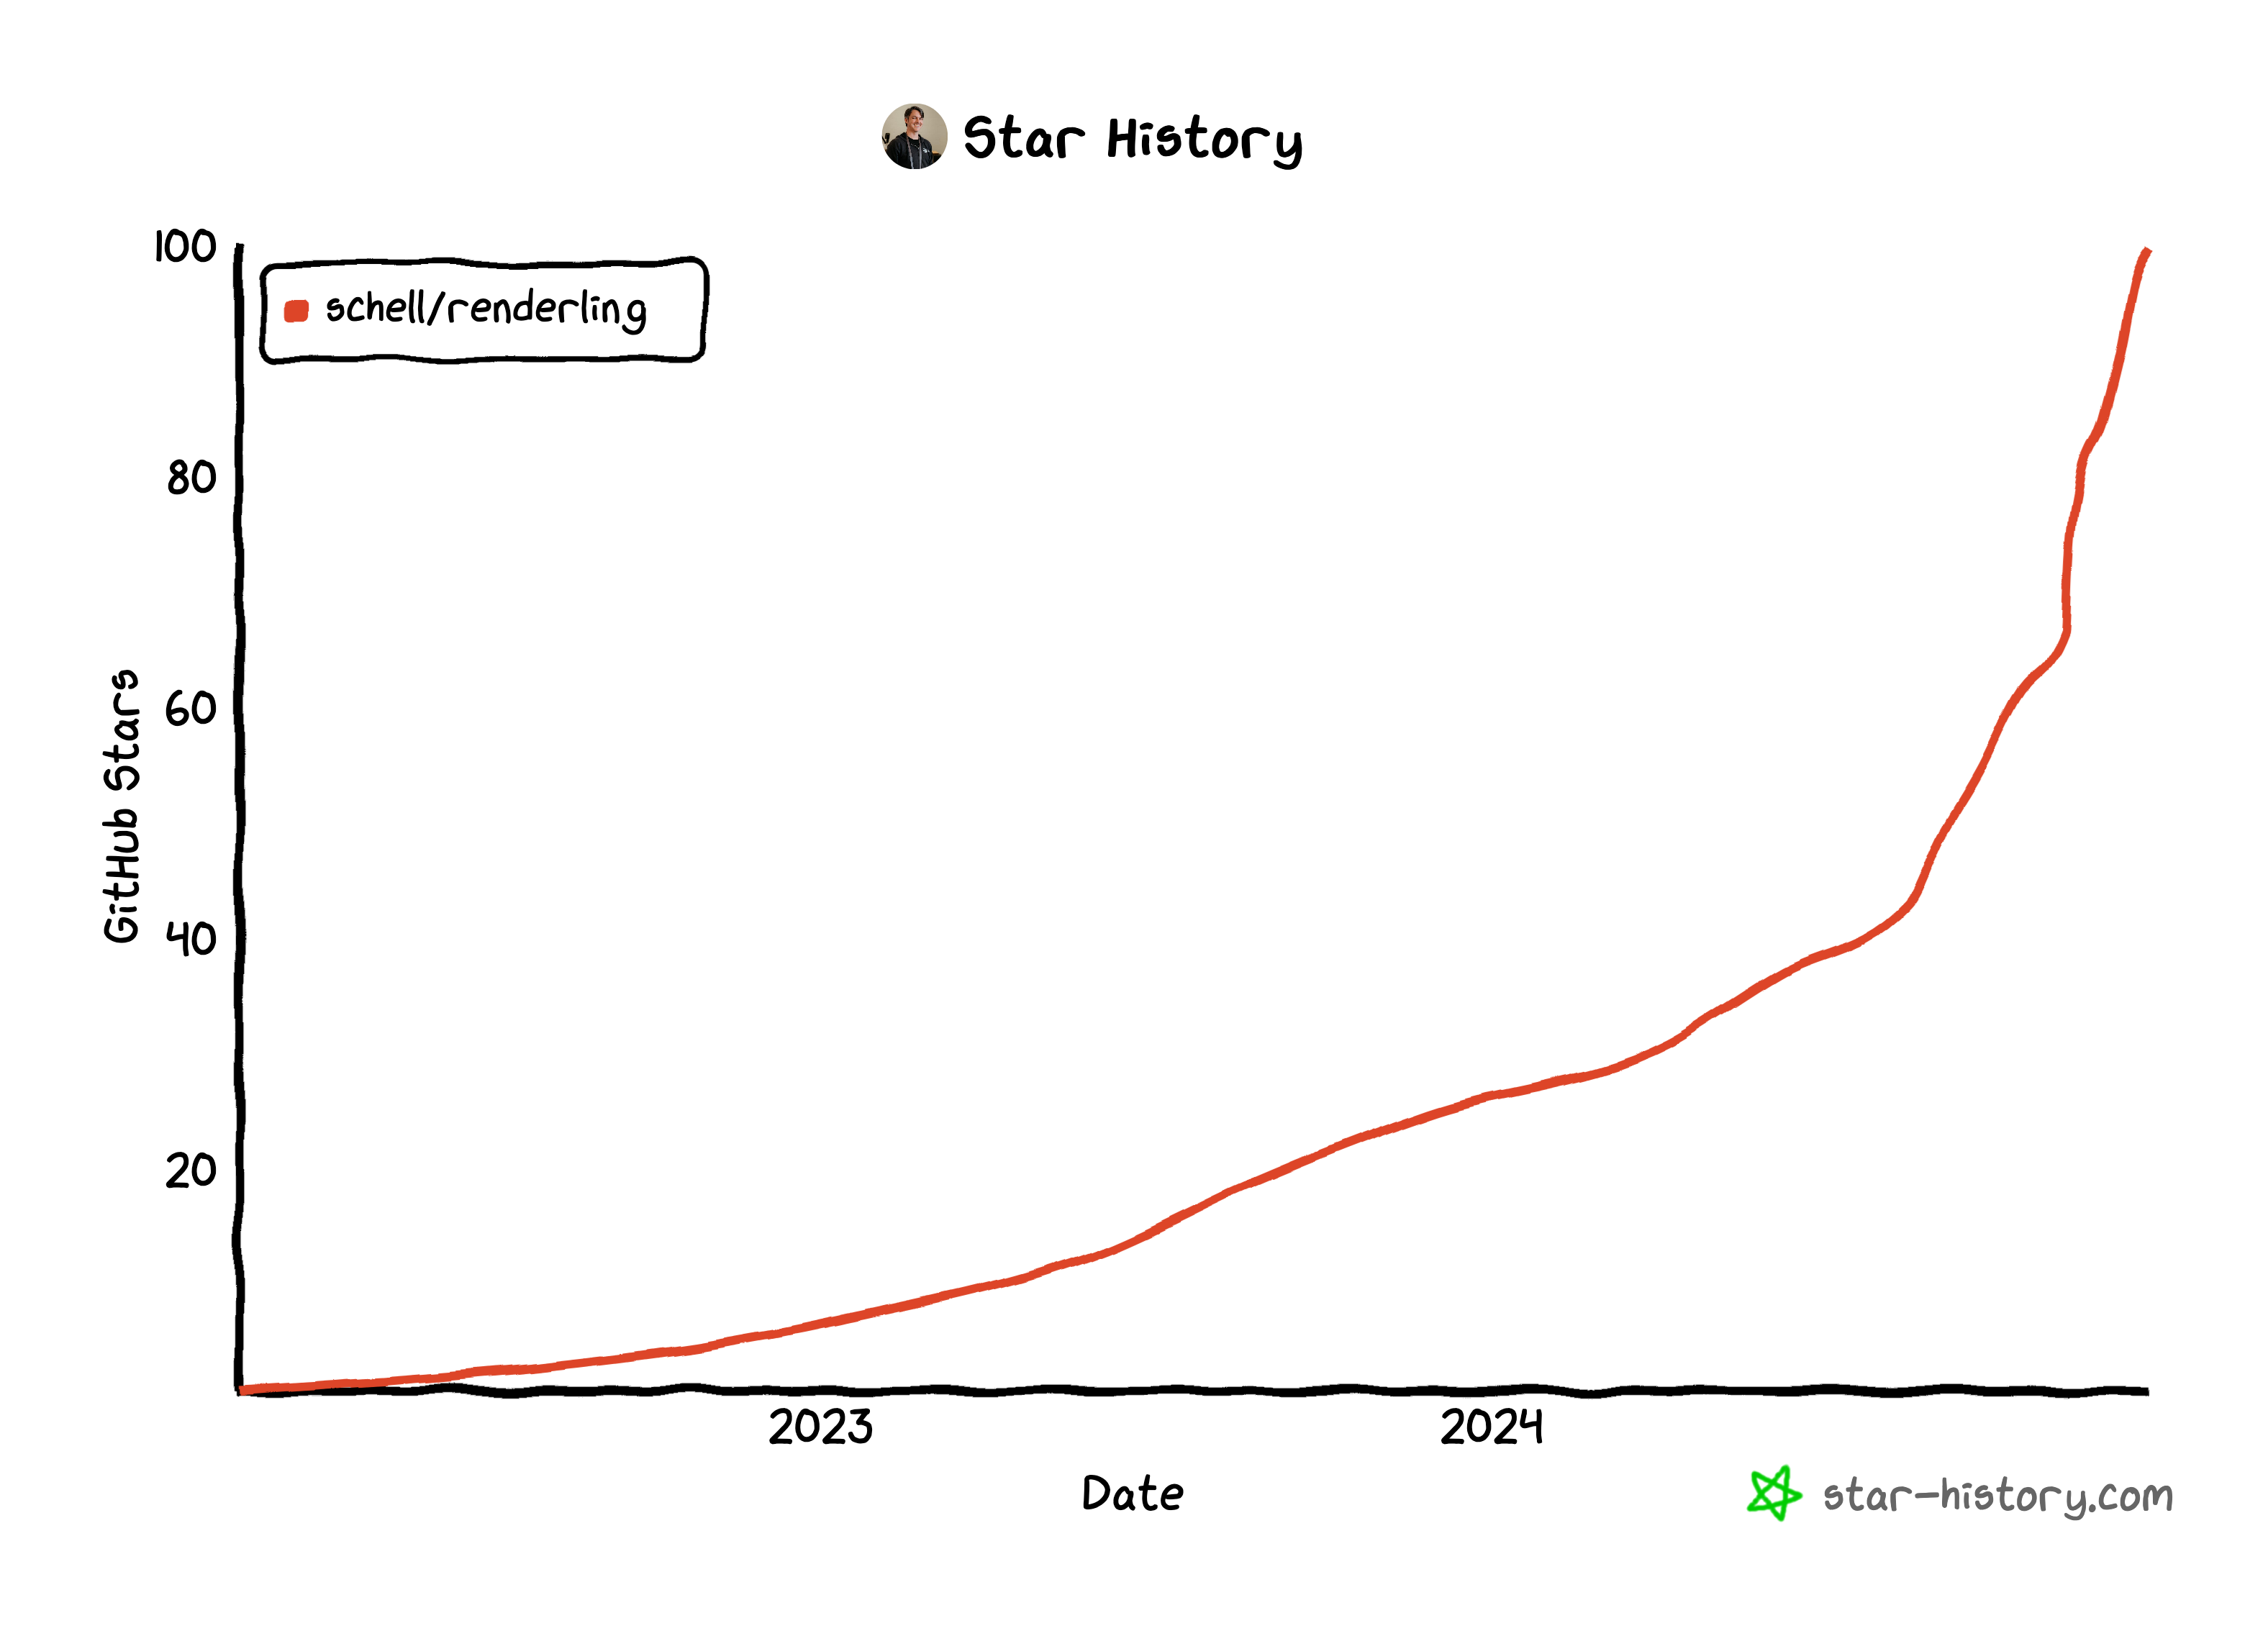
100 github stars!🔗
The project hit 100 github stars.
Here's the current graph:
Wed Dec 18, 2024🔗
nlnet update - SPIR-V Atomics in wgpu have landed! 🚀🔗
All the work adding support for atomics in the SPIR-V frontend of naga in wgpu has been finished!
https://github.com/gfx-rs/wgpu/issues/4489
Ongoing shadow mapping work🔗
I'm still working on shadow mapping.
Nothing too exciting.
No big debugging sessions.
I am thinking I'll do a recap and walkthrough of the feature once it's finished, which I'll link here. I think that will be easier to follow than my usual stream-of-consciousness live-blogging.
Sun Dec 8, 2024🔗
Folks trying out renderling on discord - renderling mentions around the web🔗
User Animats mentioned us on the r/rust_gamedev subreddit:
Renderling->WGPU
Rendering is a new renderer.
Pro:
Con:
Summary:
Technically interesting but not ready for use. Worth following progress.
They get a lot correct, but a few misunderstandings.
No bindless mode.
Well, renderling is mostly bindless apart from not being able to upload endless textures. We're limited to one giant texture array, then we only bind that one texture and sample from sub-textures stored on the slab. So at least for normal PBR rendering we're "bindless". Of course this doesn't include situations like rendering shadow maps or updating IBL probes or generating mip-maps, etc. Those all take their own textures that are separate from the atlas.
No punctual lights yet.
We definitely do support punctual lights, with the caveat that you have to hook them up yourself. In fact I'm currently implenting shadow mapping for directional and spot lights.
I should make this more apparent.
I should also make using analytical lighting easier.
Does not support general asset creation/destruction.
I'm not sure what this means.
If you "create" an asset by using Stage to create Hybrid values on the CPU+GPU, you can drop those
values at any time to "destroy" them. An asset will be made up of a bunch of these values and so dropping
them will "destroy" the asset automatically.
Of course - I should make this much more explicit in the documentation.
Technically interesting but not ready for use. Worth following progress.
Yup! And thank you! 🙇
Discord
User ValorZard mentioned us on Discord, where they are running the example glTF viewer.
That has sparked a deep dive into CI to better support Windows.
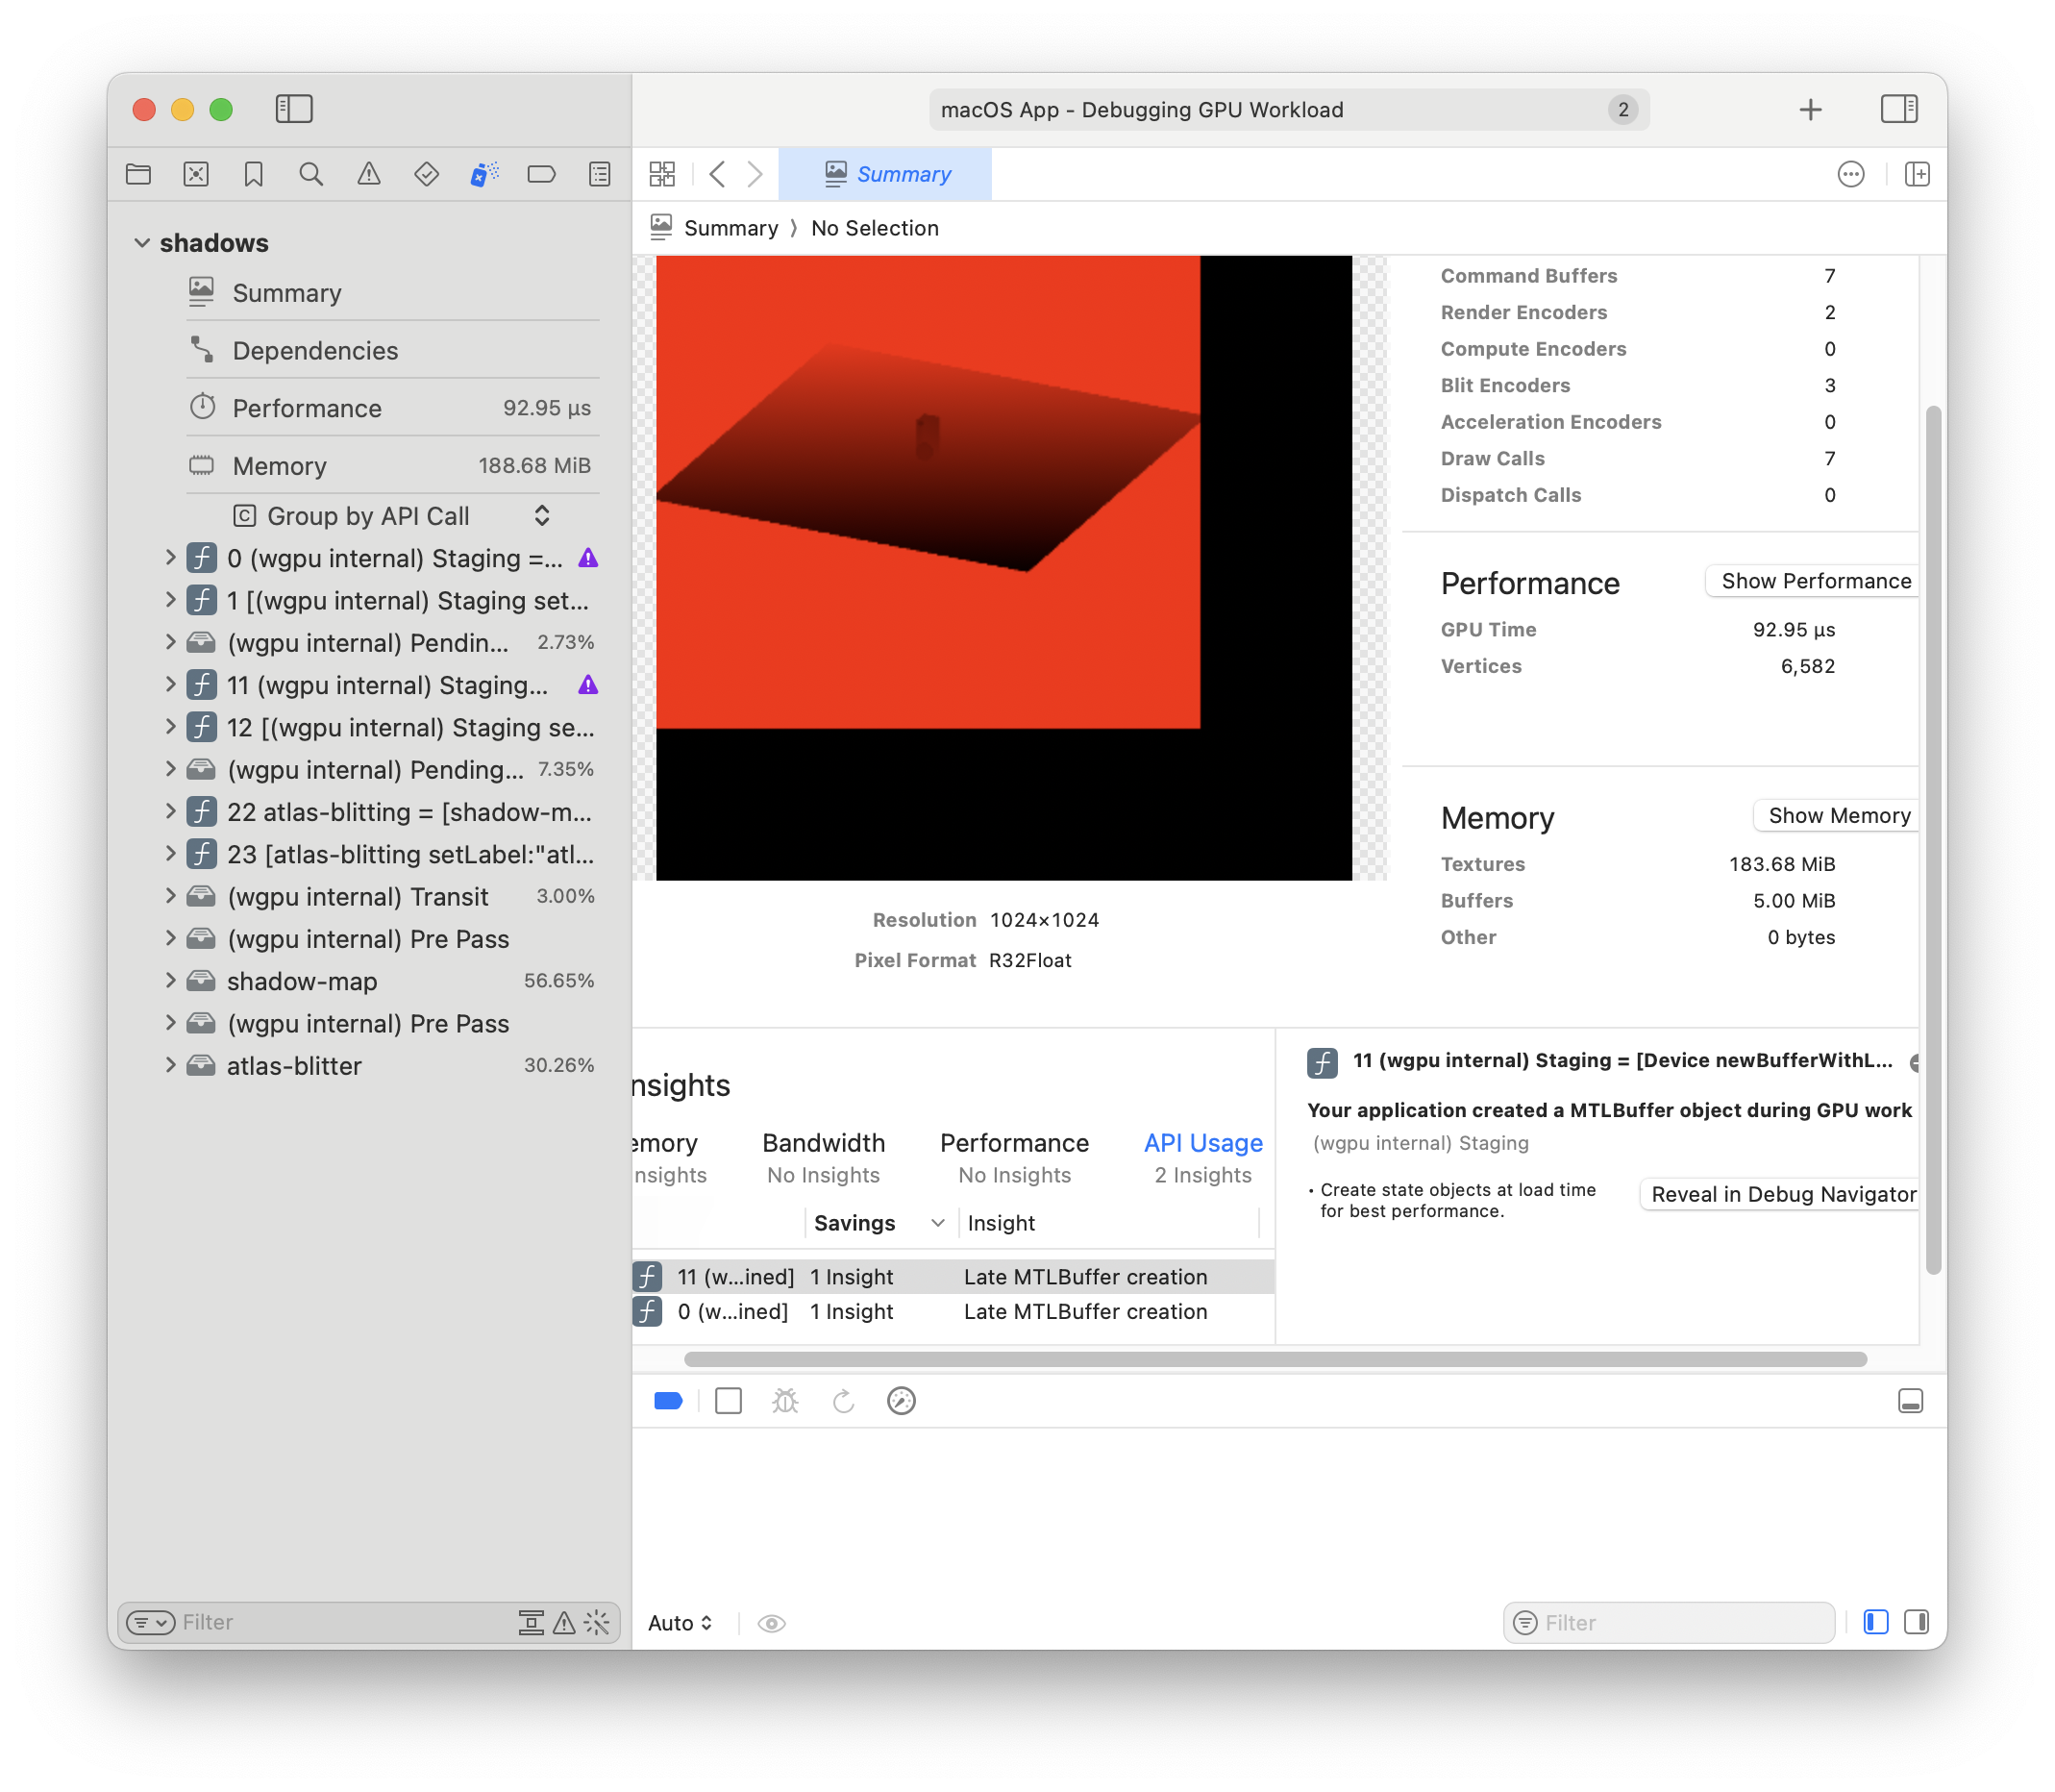
Shadow mapping progress 2🔗
I've made more progress on shadow mapping, but still nothing exciting to post.
NLnet updates - wgpu atomics and re-application for 2025🔗
I've reapplied to NLnet for 2025. 🤞.
Jim Blandy has been reviewing my PR to support OpAtomicCompareExchange and
I'm working on his suggestions.
Sat Dec 7, 2024🔗
Shadow mapping progress 1🔗
I fixed a bug where cameras loaded from glTF files were taking the wrong node transforms. It was a one-liner caused by using the "camera index" to get the node transform instead of the "node index".
I have the initial setup of shadow mapping running. Nothing significant yet.
Wed Nov 27, 2024🔗
Shadow mapping kickoff ⚽🔗
I've read the shadow mapping tutorials at learnopengl a few times now. I really love that site, it's such a great resource.
The work for shadow mapping will kick-off this week as I get time in the morning.
Sun Nov 24, 2024🔗
Back to atomics work part 2 - NLnet updates🔗
I put up a PR that provides support for OpAtomicCompareExchange.
See yesterday's notes for more info.
It's a workable solution, but it predeclares a couple types for every module that comes through the SPIR-V frontend. I think that's fine, but it's not the most elegant solution. A more elegant solution would be to add more type-upgrade machinery, but I think that could get out of hand pretty quickly.
Next up - shadow mapping!🔗
Next on the docket is shadow mapping. I'll be using learnopengl's shadow mapping tutorial for the initial implementation.
Sat Nov 23, 2024🔗
The ecosystem is heating up - renderling mentions around the web🔗
Until now I've been the only one talking about Renderling, but this week that changed!
Below the user Animats talks about Renderling on HN and Reddit, and generally says nice things about the project.
Bevy, Rend3, and Renderling, the next level up, all use WGPU. It's so convenient.
User Animats, on Hacker news - comment on article "What's Next for WebGPU"
I've been looking at Renderling, a new renderer. See my notes...
User Animats, on Reddit r/rust_gamedev - post "The My First Renderer problem "
User Animats, on Reddit r/vulkan - post "Approaches to bindless for Rust"
Other developments - Nvidia🔗
I also have a scheduled meeting with someone at Nvidia. We'll be talking about how the Rust community uses the GPU. Roughly.
Back to atomics work - NLnet updates🔗
I'm back working on the last round of atomic support in the naga frontend.
See my WIP PR for atomic compare exchange at https://github.com/gfx-rs/wgpu/pull/6590.
Initially I thought the problem was going to take some new type-upgrade machinery, similar to the existing machinery. But now I think the problem might be a bit more like this texture sampling issue https://github.com/gfx-rs/wgpu/issues/4551, in that WGSL and SPIR-V differ in their parameters and return results.
I fixed that ticket by adding a step inline to provide the downstream code with what it expected in SPIR-V.
I'm hoping I can do the same thing with OpAtomicCompareExchange.
notes/deep dive on supporting OpAtomicCompareExchange
note that the spec is for
atomicCompareExchangeWeak, but SPIR-V also hasOpAtomicCompareExchangeWeakand that spec says:Has the same semantics as OpAtomicCompareExchange
So I think it's fine and I won't worry about it.
So - Rust-GPU and SPIR-V expect the return value of this op to be the same as the underlying atomic's value.
WGSL, however, expects this to be a struct like this:
struct __atomic_compare_exchange_result{ old_value : T, // old value stored in the atomic exchanged : bool // true if the exchange was done }
...and then the WGSL spec goes on to say:
Note: A value cannot be explicitly declared with the type __atomic_compare_exchange_result, but a value may infer the type.
So we don't have to define this result type, I don't think. Instead, we should be able to access it with the dot operator.
It would be nice to find an example of WGSL's atomicCompareExchangeWeak being used in the wild...
That helps!
It looks like these examples all access the struct values using the dot operator.
Ok - on to mapping between the two calls.
WGSL and SPIR-V all take the same parameters (in a slightly different order), so we're good there.
It's really just that WGSL returns whether or not the value was updated. This could be determined at the call site by comparing the result with the comparator (based on the specs - if they are equal, the atomic was updated), so I'm guessing WGSL does this as an optimization to avoid a costly comparison?
Anyway, I think the only thing we need to do is use the dot operator on the result, inline. So indeed this is just like the texture sampling issue I linked above. I might actually ship this today!
Wed Nov 20, 2024🔗
I have become a Rust-GPU maintainer🔗
I'm now a maintainer of the Rust-GPU compiler!
Ergonomics, stability, developer experience and integration with wgpu will be my focus on this project.
Temporarily setting aside occlusion culling🔗
I'm putting occlusion culling aside while I finish up my NLnet grant work. I've applied for a grant for next year and we'll see how that goes 🤞.
For the remainder of the year I'll be working on the last bit of atomics work and shadow mapping. If I have time I'll put some work into improving documentation and creating a sample app.
Renderling growth 2024🔗
Wow! Renderling has grown a lot this year!
Measuring by the number of stars on the github repo we've grown by 219%!
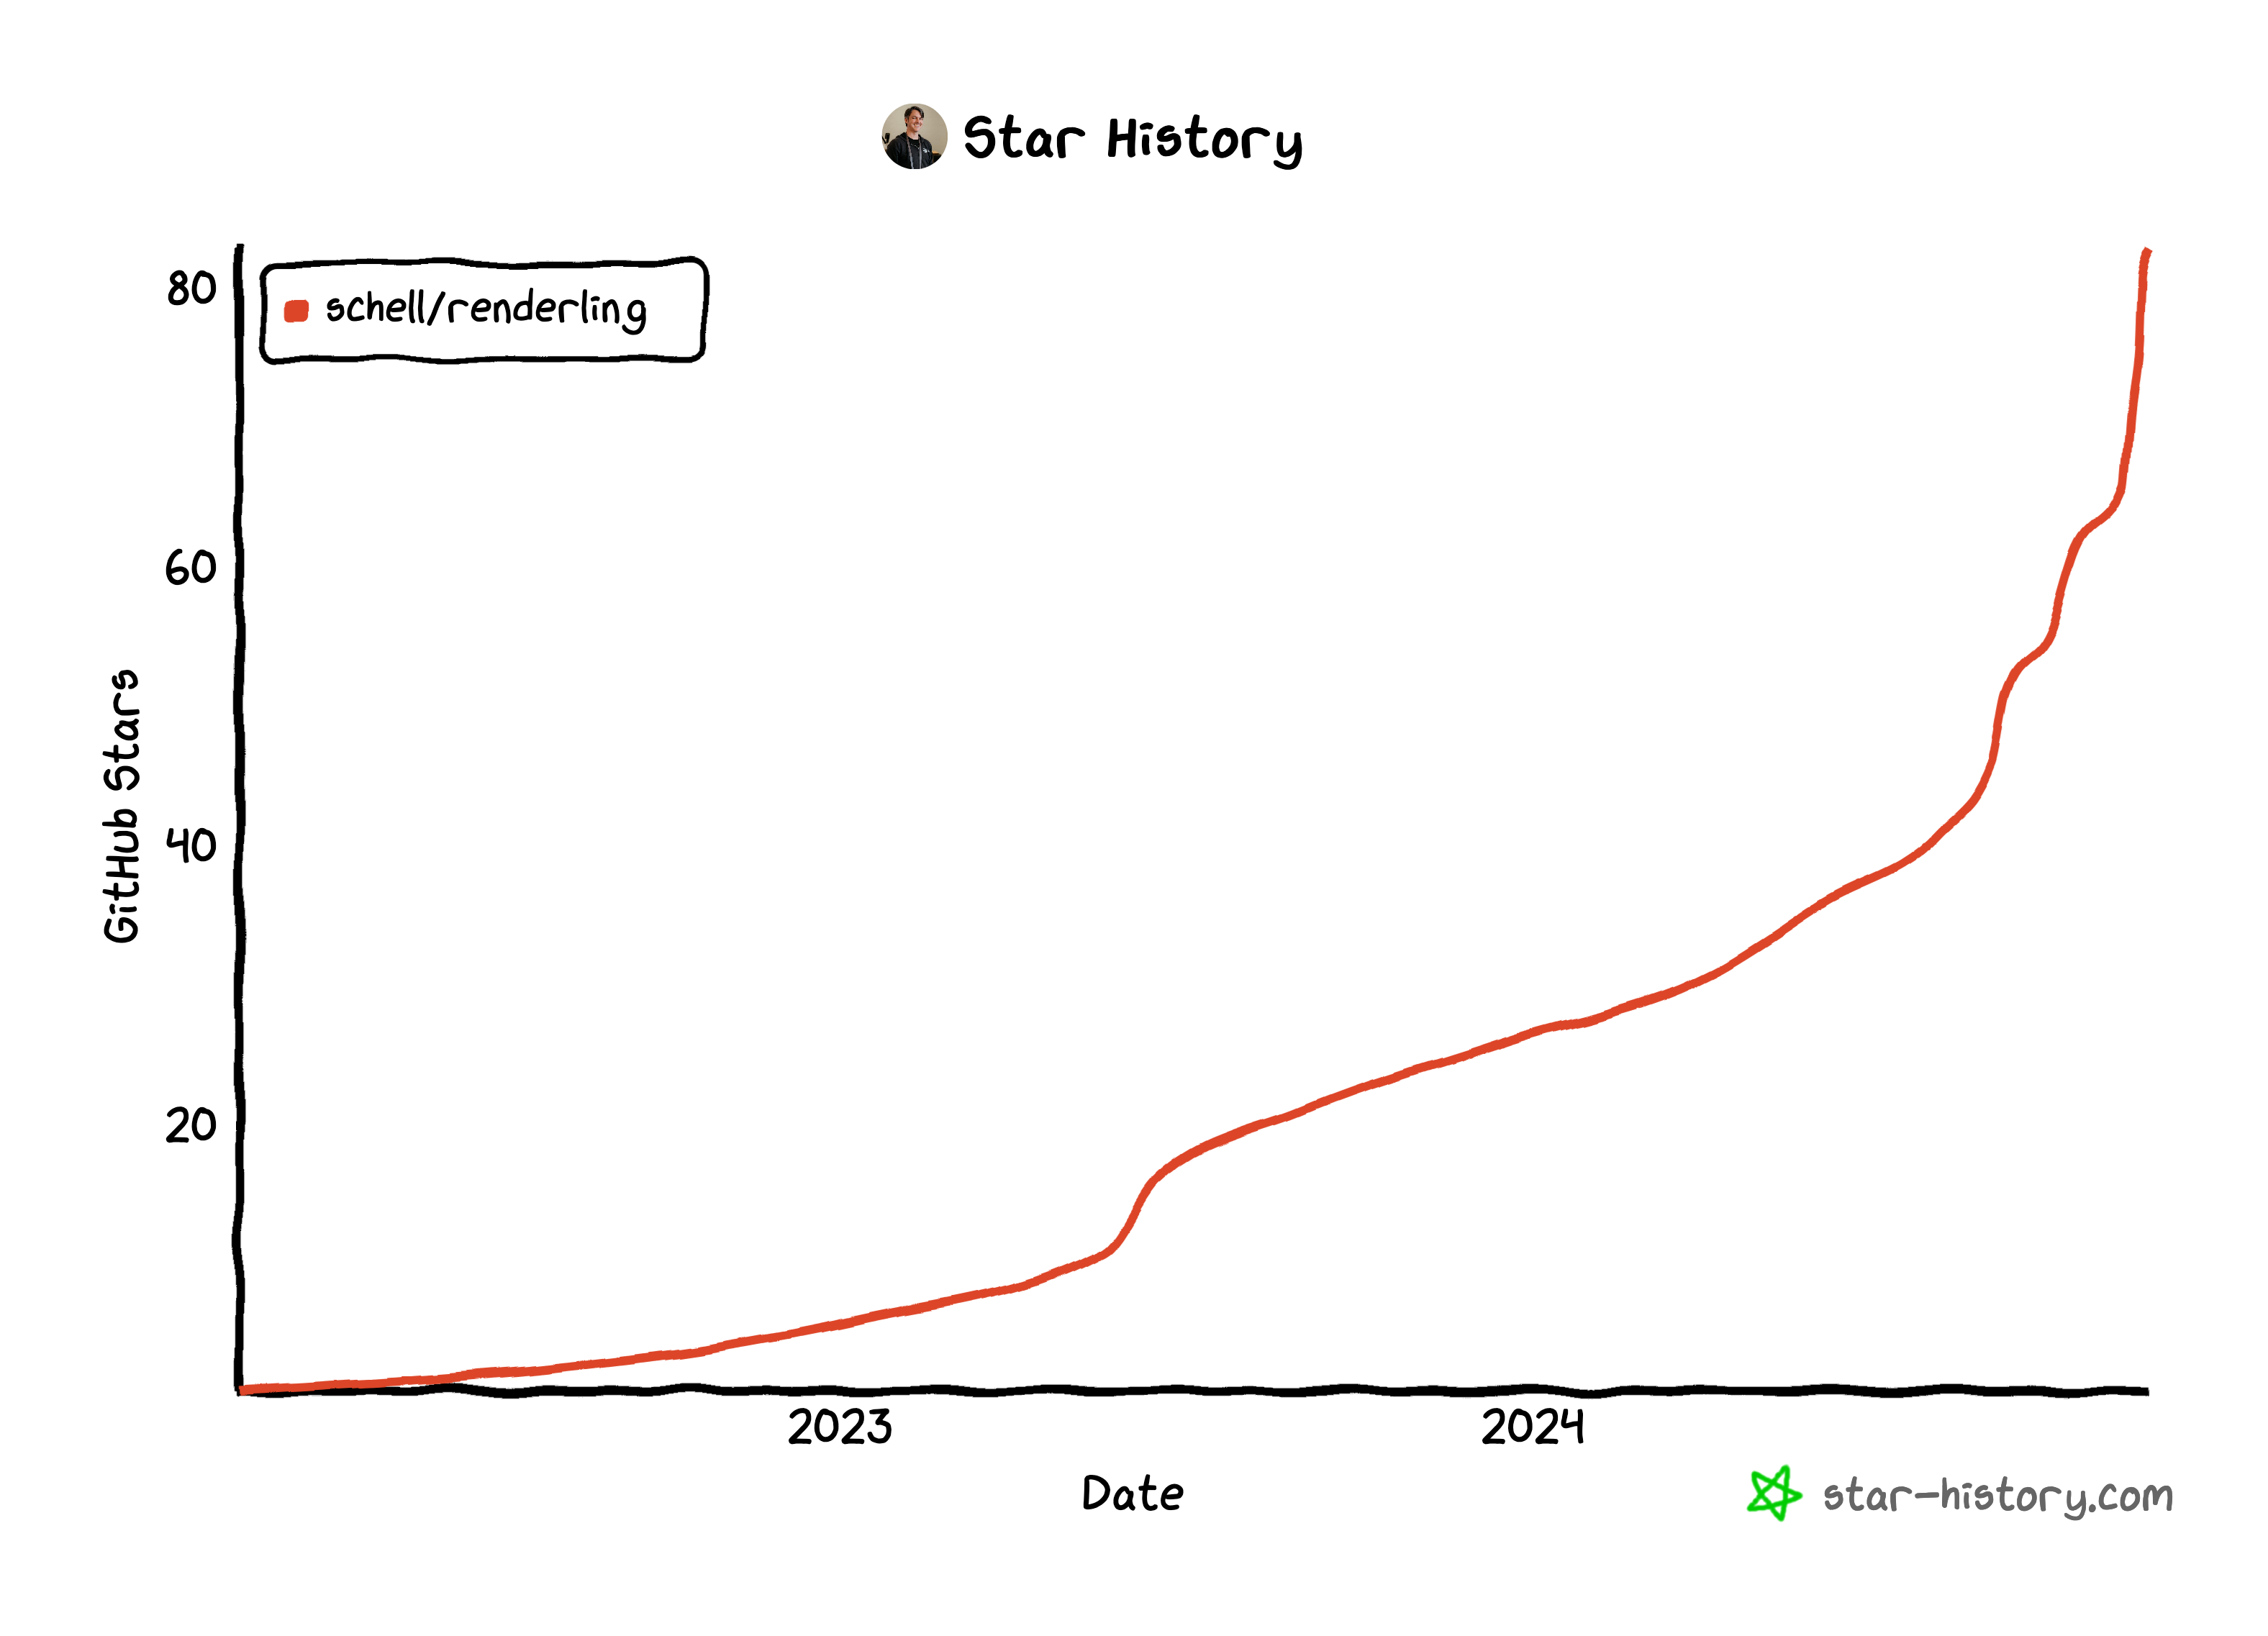
That's a hockey stick if I ever saw one 😊.
☕☕☕
Sat Nov 2, 2024 & Sun Nov 3, 2024🔗
More burnout avoidance while tackling occlusion culling🔗
I've taken a small hiatus this past week, only poking around a little by writing a debugging overlay shader that displays bounding volumes, and then trying it out on different models to check their bounds.
As you can see, only two have visible bounds, which means the rest either have a boundary that surpasses the NDC cube, none at all, or something else is going on.
You can also see that the framerate is really low!
When profiling in Xcode using the metal frame-capture machinery, the profiling tells me that the debug overlay fragment shader is responsible for 98% of the frame time.
It's not totally surprising, though, given that it loops over every draw
call, reading that call's Renderlet and then projecting it and possibly coloring
the fragment based on its proximity to the bounding sphere.
But I guess it is surprising given that most of these models only have one or two draw calls. So that loop is not very long.
Now I'm reading about shader optimization from https://developer.apple.com/documentation/xcode/optimizing-gpu-performance/ to see what I can do to gain some insight. I can see from my frame capture that the "occupancy" is low in the debug overlay shader. I think that means that the difference invocations of the shader are hitting different branches.
Deeper into shader profiling with Xcode on occlusion culling🔗
Following https://developer.apple.com/documentation/xcode/optimizing-gpu-performance/#Optimize-shaders-with-per-line-shader-profiling-statistics I can see my shader with weights attached! Pretty cool.
I mean, it's not my Rust code, but it's easier to read that SPIR-V 👍.
I can see there's an inner function that's taking ~60%-90% of the time
slice. This is how naga constructs its shaders. It always makes an inner
function and then calls that from the main.
Inside that function are the cost centers I'm interested in. There's a number of them, the bigger ones from 5%-12%.
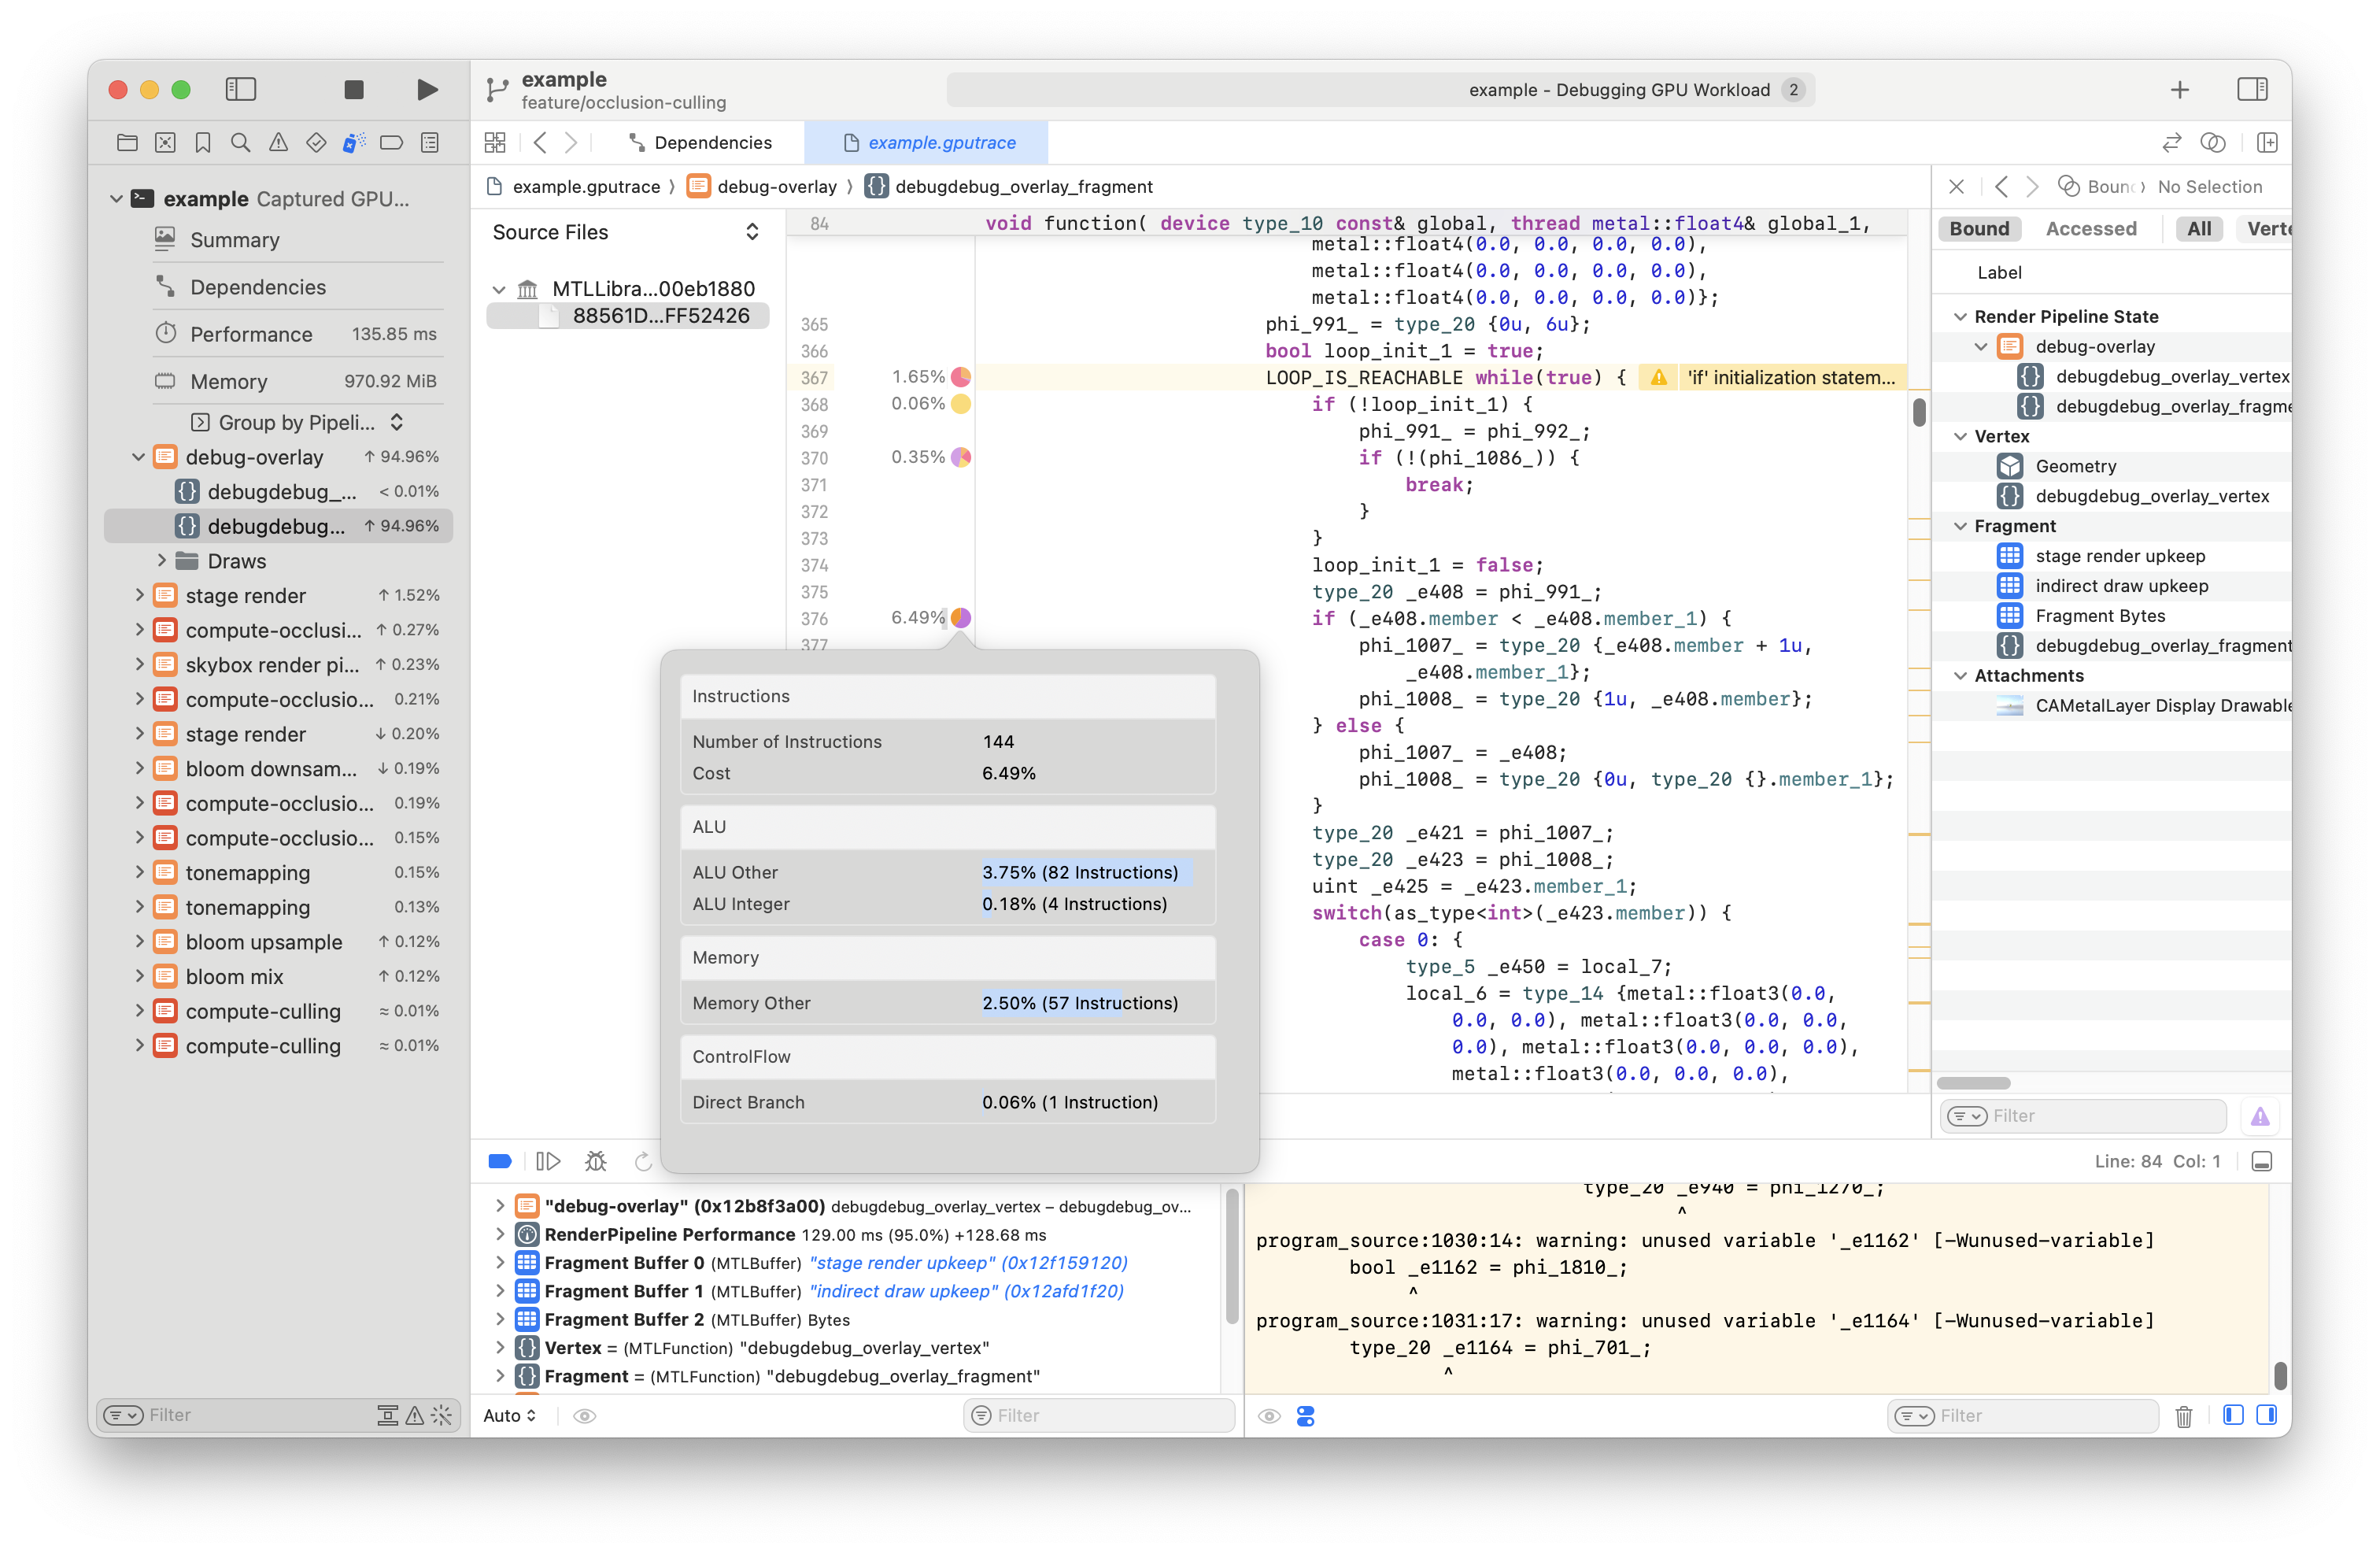
In the second case it's actually pretty hard to see what the conditional is about. I really wish I had a source map to get back to my Rust code...
Kinda thrashing but guided by profiling on occlusion culling🔗
I'm thrashing a bit, but removing two of the conditionals in the debug overlay
fragment shader got the cost down to 50%. I'll remove as many more conditionals
as I can, and I'll use
Slab::read_unchecked
on the slab items that I know will always be populated and I'll see what
happens...
...on a side note, my Rust shader compilation times are at around
46seconds... ...it's hurting a bit. I need
https://github.com/Rust-GPU/rust-gpu/pull/21 to land to speed up
these dev cycles...
Slab::read_unchecked to the rescue, occlusion culling🔗
That really sped it up! Changing a few calls to read_unchecked changed
the shader execution time -68%. The example app is now usable! ☕☕☕lol.
But can we go further? Even though the total frame time went from 120ms to
38ms, that's not fast enough for real-time. We need it to get down to
16ms.
...
These Xcode profiling tools are pretty cool. But I can't help but want GPU flamegraphs. I wonder how difficult it would be to transform Metal flamegraphs into SPIR-V into Rust...
...I'm not going to think very hard about that!
...⏱️
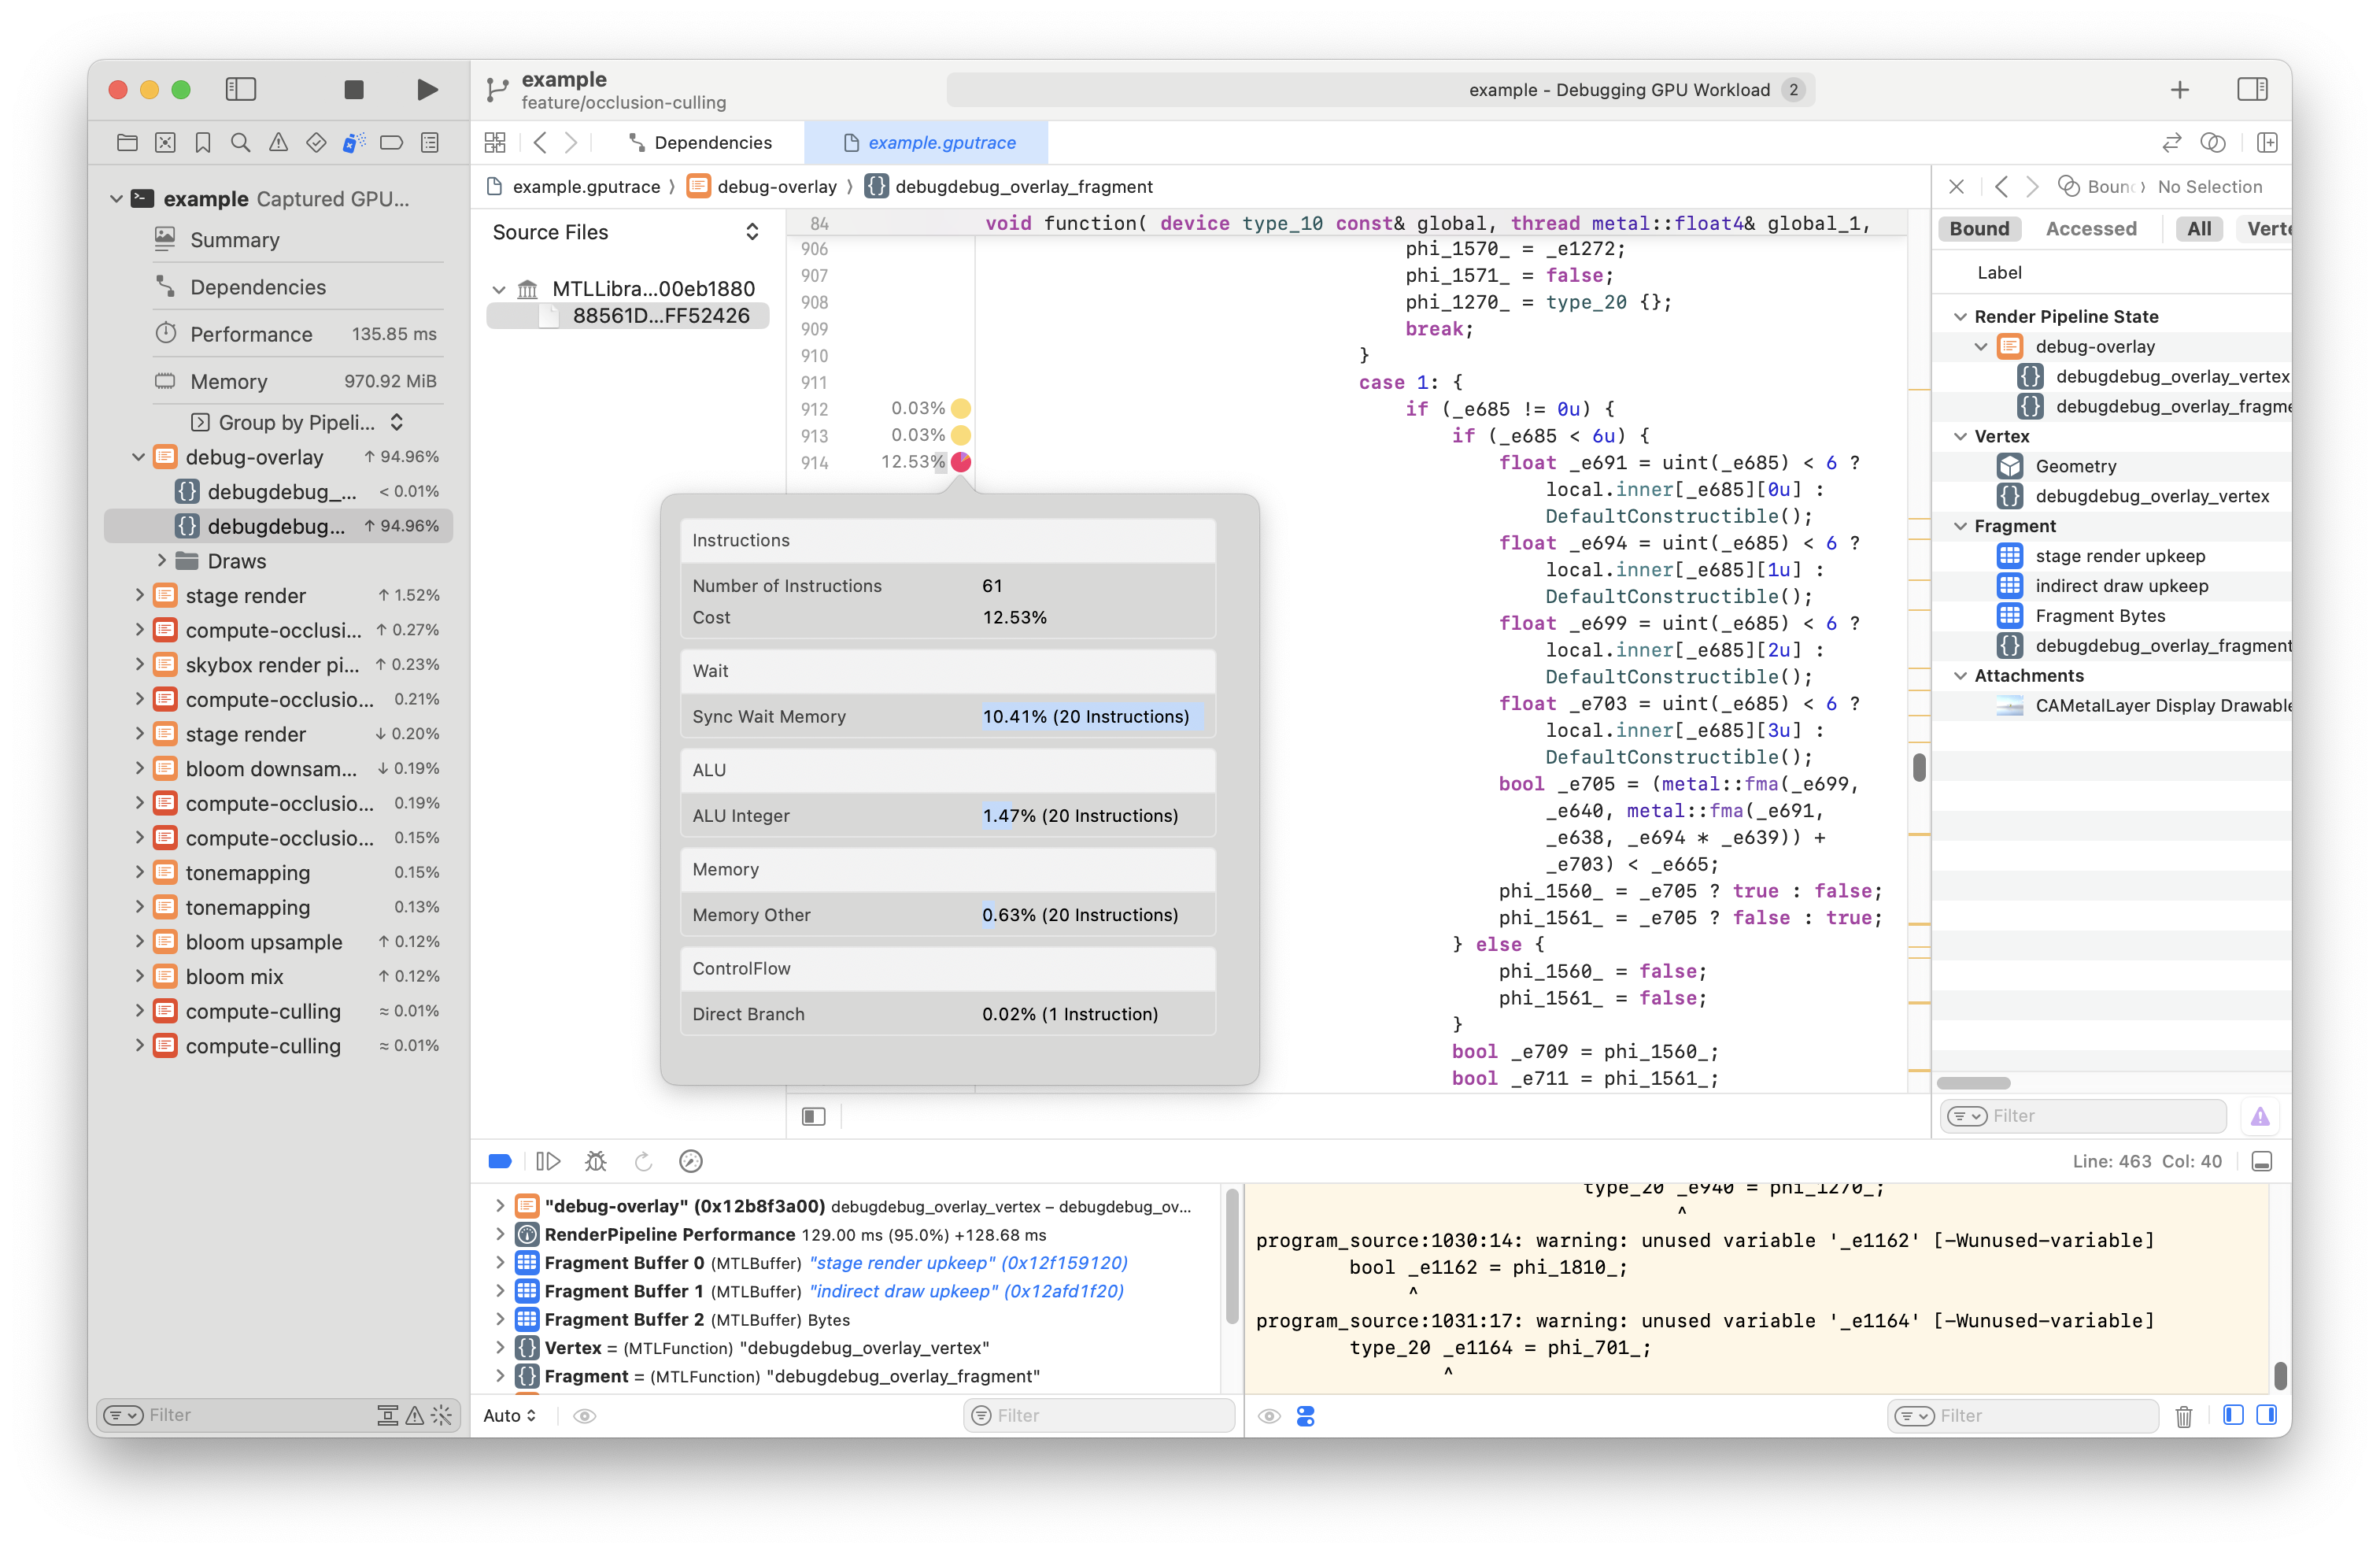
So, more profiling.
I can see that the last cost center in my debug overlay fragment shader is this line:
float _e685 = uint(_e680) < 8 ? local_1.inner[_e680][0u] : DefaultConstructible();
where
struct DefaultConstructible {
    template<typename T>
    operator T() && {
        return T {};
    }
};
Climbing up the tree of all those variables and their types (_e680, local_1) is pretty
difficult, and my intuition says that it's a big read from the slab... ...so I'll thrash
a bit and hazard a guess that it's from this line in my shader:
    let PbrConfig {
        atlas_size: _,
        resolution: viewport_size,
        debug_channel: _,
        has_lighting: _,
        has_skinning: _,
        has_compute_culling: _,
        light_array: _,
    } = slab.read_unchecked(Id::new(0));
Which upon inspection, I see that we're doing this read_unchecked on a pretty big struct
and then ignoring all the fields except resolution, which I can replace with some pointer
math, and only read the one field.
The sad bit is that crabslab used to generate offset identifiers for each field of a struct
automatically in the SlabItem derive macro, but I removed that because of compilation times.
It didn't add a ton, but I was trying to reduce compilation times by any means necessary.
On occlusion culling and reading as little as possible🔗
Before replacing the big PbrConfig read with a smaller read of just the
resolution: viewport_size, the frame time was about 35ms...
...and after it looks to be ~31ms, so that's a possibly significant reduction,
about 11%. Let's see what happens if I go further. I can write a macro that would make
this a lot easier...
...fortunately I have a lot of this work in git, I just have to resurrect it.
...⏱️
So now I've replaced the PbrConfig read and also the Renderlet read with a few smaller
reads.
...aaaaaand Xcode crashed. I reflexively didn't look at the crash report, it happens often enough 😭.
The changes brought down the frame time to ~33ms. Really not much.
The cost centers look the same, pretty much.
I'm going to thrash a little more and change the type of loop from a for _ in 0.._ to loop,
though I'm starting to think that the bulk of the cost is in calculating the
projected bounding sphere of the renderlet. This will be my last optimization
attempt before moving on. I think another optimization down the road may be to
do 2-pass occlusion culling where the first pass calculates a visibility buffer
that includes this information.
So that didn't end up with any gains.
I did, however, stumble into an odd bug where different inline annotations seem to change the results of the debug overlay shader.
Sat Oct 26, 2024🔗
Occlusion culling and avoiding burnout🔗
I'm just coming back to this after an intense day job work week in which I didn't touch renderling at all.
I'm quite focused on my burnout level, and I really don't want to cross the threshold for too long, if at all.
I've burned out on side projects before, and so I like to think that I can feel the burnout coming. Essentially, when I don't feel like hacking on a project I have to back off and not force myself. I have to forget all the blogs I've read that insist "grit and persistence" are the surest means to success. Even if that's true, my body is telling me to take a break, so I have to heed that warning.
So today doesn't have much of an update.
I fixed an issue where the MSAA sample count wasn't being updated, which was causing the occlusion culling depth pyramid (aka the "HZB") to be invalidated each frame.
But even after all the debugging and bug fixing, there's still something fundamentally wrong with the algorithm. The Objects' visibility are still unstable like in the video I posted below.
I think maybe I need to expand the bounding spheres of the objects a bit, but I don't want to just thrash around.
Tomorrow or later today (or whenever I feel rejuvenated) I'll add a layer of debug rendering so I can see what's going on...
Fri Oct 18, 2024 & Sat Oct 19, 2024 & Sun Oct 20, 2024🔗
Pre-debugging occlusion culling results🔗
Sometimes it's hard to write about failure, so I'll let the video do the talking:
As you can see the frame rate is worse! It's at ~6FPS now.
I could just dive right in at this point, trying to figure out why it's so slow, but it's also obviously incorrect in that it's culling the wrong things.
So I'll take some time to pick apart my occlusion culling shader and verify its different steps first.
Debugging occlusion culling🔗
First we'll build the scene. We'll need some little cubes, we'll put them in the corner.
Then we'll add a floor that occludes the little cubes.
Then we'll add a green cube in the middle.
Then we'll add a purple cube that occludes the green one.
You should still be able to see the two little cubes at the top.


Then we'll extract the depth buffer and the hierarchical z-buffer


Everything looks in order. Now we can start running the shader on the CPU...
HZB cull shader debugging on the CPU, gathering buffers🔗
This is the type of the function that computes culling:
#[spirv(compute(threads(32)))]
pub fn compute_culling(
    #[spirv(storage_buffer, descriptor_set = 0, binding = 0)] stage_slab: &[u32],
    #[spirv(storage_buffer, descriptor_set = 0, binding = 1)] depth_pyramid_slab: &[u32],
    #[spirv(storage_buffer, descriptor_set = 0, binding = 2)] args: &mut [DrawIndirectArgs],
    #[spirv(global_invocation_id)] global_id: UVec3,
)
In order to call this from the CPU we'll need those three buffers, so I have to read those from the GPU in my test.
        // The stage's slab, which contains the `Renderlet`s and their `BoundingSphere`s
        let stage_slab =
            futures_lite::future::block_on(stage.read(&ctx, Some("read stage"), ..)).unwrap();
        let draw_calls = stage.draw_calls.read().unwrap();
        let indirect_draws = draw_calls.drawing_strategy.as_indirect().unwrap();
        // The HZB slab, which contains a `DepthPyramidDescriptor` at index 0, and all the
        // pyramid's mips
        let depth_pyramid_slab = futures_lite::future::block_on(
            indirect_draws
                .compute_culling
                .compute_depth_pyramid
                .depth_pyramid
                .slab
                .read(&ctx, Some("read hzb desc"), ..),
        )
        .unwrap();
        // The indirect draw buffer
        let mut args_slab =
            futures_lite::future::block_on(indirect_draws.slab.read(&ctx, Some("read args"), ..))
                .unwrap();
        let args: &mut [DrawIndirectArgs] = bytemuck::cast_slice_mut(&mut args_slab);
        // Number of `DrawIndirectArgs` in the `args` buffer.
        let num_draw_calls = draw_calls.draw_count();
This is why I love using rust-gpu. I just don't know how
I would do this kind of debugging in GLSL or WGSL, etc.
HZB cull shader debugging on the CPU, naming and dispatch🔗
Here's the source of the cull shader so you can follow along.
So, usually the compute cull shader gets called like this:
compute_pass.dispatch_workgroups(num_draw_calls / 32 + 1, 1, 1);
What I'm going to do is put in some logging and just call the compute_culling
function with these buffers and assert some values.
Starting with the gid (x of invocation id), renderlet id and bounding sphere.
Before that, we need to know the names of the renderlets:
id: Id(1054), name: yellow_cube_top_left
id: Id(2018), name: yellow_cube_top_right
id: Id(2982), name: yellow_cube_bottom_right
id: Id(3946), name: yellow_cube_bottom_left
id: Id(4130), name: floor
id: Id(5094), name: green_cube
id: Id(6058), name: purple_cube
Now we can match renderlet id to the name.
HZB cull shader debugging on the CPU, printing all the things🔗
Ok, I've added a ton of print statements to the shader function. Let's run it.
gid: 0
renderlet: Id(1054) // yellow_cube_top_left
renderlet is inside frustum
center_ndc: [-0.8047378, 0.8047378, 0.99766433]
screen space bounds center: [0.0976311, -0.9023689, 0.99766433]
screen space bounds radius: 1.0756001
screen max dimension: 128
renderlet size in pixels: 275.35364
selected mip level: 8
mip (x, y): (0, -0)
thread 'cull::cpu::test::occlusion_culling_debugging' panicked at /Users/schell/.cargo/registry/src/index.crates.io-6f17d22bba15001f/crabslab-0.6.1/src/lib.rs:38:6:
index out of bounds: the len is 21863 but the index is 4294967295
Whaaaa! Panic! Well that's definitely a problem, lol. Let's see...
The backtrace tells me it was this line of the shader:
let depth_in_hzb = depth_pyramid_slab.read_unchecked(depth_id);
And depth_id is determined by the mip_level and the x and y of the mip.
Well - right off the bat we know that mip_level is out of bounds. We only have 7 mips, and it wants index 8!
Working up the chain we can see that renderlet size in pixels: 275.35364 is
obviously wrong, as the image is only 128x128 pixels.
Let's just go top down and mentally sanity check these values...
center_ndc: [-0.8047378, 0.8047378, 0.99766433]This seems correct - it's the top left, near the back. That's where we put the top-left yellow cube so that tracks.screen space bounds center: [0.0976311, -0.9023689, 0.99766433]This doesn't make sense. We're looking to putcenter_ndcinto screen space, which has an x and y range of [0, 1] and the origin at the top left.I think it's this:
(center_ndc.y + 1.0) * -0.5Instead I think we should do
1.0 - (center_ndc.y + 1.0) * 0.5...
After that change we get this output:
gid: 0
renderlet: Id(1054)
renderlet is inside frustum
center_ndc: [-0.8047378, 0.8047378, 0.99766433]
screen space bounds center: [0.0976311, 0.0976311, 0.99766433]
screen space bounds radius: 1.0756001
screen max dimension: 128
renderlet size in pixels: 275.35364
selected mip level: 8
mip (x, y): (0, 0)
thread 'cull::cpu::test::occlusion_culling_debugging' panicked at /Users/schell/.cargo/registry/src/index.crates.io-6f17d22bba15001f/crabslab-0.6.1/src/lib.rs:38:6:
index out of bounds: the len is 21863 but the index is 4294967295
It still panic'd, but the screen space center of the top-left yellow cube looks correct.
But the radius seems wrong. The cube is definitely more than 2 pixels in width. Let's open the frame in preview (macOS):
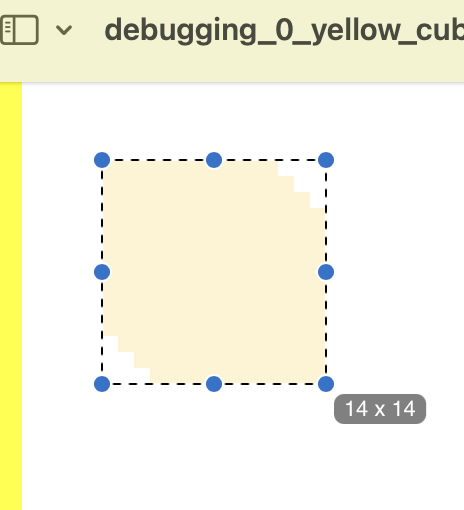
Yeah, 14px.
So I see what's going on here. I'm not correctly projecting the sphere onto the "screen plane".
...
After a good while of poking around I came up with a function on BoundingSphere
to project into pixel-space:
    pub fn project_onto_viewport(&self, viewproj: Mat4, viewport: Vec2) -> (Vec2, Vec2) {
        fn ndc_to_pixel(viewport: Vec2, ndc: Vec3) -> Vec2 {
            let screen = Vec3::new((ndc.x + 1.0) * 0.5, 1.0 - (ndc.y + 1.0) * 0.5, ndc.z);
            (screen * viewport.extend(1.0)).xy()
        }

        // Find the center and radius of the bounding sphere in pixel space, where
        // (0, 0) is the top-left of the screen and (w, h) is is the bottom-left.
        let center_clip = viewproj * self.center.extend(1.0);
        let center_pixels = ndc_to_pixel(viewport, center_clip.xyz() / center_clip.w);

        let radius_pixels = Vec2::new(
            (self.radius / center_clip.w) * viewport.x,
            (self.radius / center_clip.w) * viewport.y,
        );

        (center_pixels - radius_pixels, center_pixels + radius_pixels)
    }
And for our top-left yellow cube, that gives us:
sphere_aabb: (
    Vec2(
        5.106697,
        5.106697,
    ),
    Vec2(
        19.886864,
        19.886864,
    ),
)
...which is correct!
So now we've got the correct projection 👍.
HZB cull shader debugging on the CPU, projecting the bounds as an AABB+depth🔗
All that leaves for us to figure out - is the depth of the "front" of the bounding sphere.
In this shader we already have the camera, which contains the frustum.
We can use the frustum to determine the normals "into camera" and "out
from camera" - they're simply the first three components (xyz) of the
frustum planes. We can use those to figure out the locations of the "front"
and "back" of the sphere in our sphere projection function.
...
So, after adding that into the projection function, said function returns an AABB, where xy components are in pixels and z is in NDC (depth).
Now I think things are good-to-go! We get this output from our shader:
gid: 0
renderlet: Id(1054)
renderlet is inside frustum
znear: [0, 0, -1, 9.949975]
 zfar: [-0, -0, 1, 90.00072]
sphere_aabb: Aabb {
    min: Vec3(
        5.106697,
        5.106697,
        0.99745977,
    ),
    max: Vec3(
        19.886864,
        19.886864,
        0.9978464,
    ),
}
screen max dimension: 128
renderlet size in pixels: 20.902311
selected mip level: 4 8x8
center: [12.49678, 12.49678]
mip (x, y): (0, 0)
depth_in_hzb: 1
depth_of_sphere: 0.99745977
I've printed out the znear and zfar of the camera's frustum just to be certain.
Let's run this for the rest of the draw calls...
[2024-10-19T19:45:34Z INFO  renderling::cull::cpu::test] name: yellow_cube_top_left
gid: 0
renderlet: Id(1054)
renderlet is inside frustum
znear: [0, 0, -1, 9.949975]
 zfar: [-0, -0, 1, 90.00072]
sphere_aabb: Aabb {
    min: Vec3(
        5.106697,
        5.106697,
        0.99745977,
    ),
    max: Vec3(
        19.886864,
        19.886864,
        0.9978464,
    ),
}
screen max dimension: 128
renderlet size in pixels: 20.902311
selected mip level: 4 8x8
center: [12.49678, 12.49678]
mip (x, y): (0, 0)
depth_in_hzb: 1
depth_of_sphere: 0.99745977
[2024-10-19T19:45:34Z INFO  renderling::cull::cpu::test]
[2024-10-19T19:45:34Z INFO  renderling::cull::cpu::test] name: yellow_cube_top_right
gid: 1
renderlet: Id(2018)
renderlet is inside frustum
znear: [0, 0, -1, 9.949975]
 zfar: [-0, -0, 1, 90.00072]
sphere_aabb: Aabb {
    min: Vec3(
        108.11314,
        5.106697,
        0.99745977,
    ),
    max: Vec3(
        122.8933,
        19.886864,
        0.9978464,
    ),
}
screen max dimension: 128
renderlet size in pixels: 20.902311
selected mip level: 4 8x8
center: [115.50322, 12.49678]
mip (x, y): (7, 0)
depth_in_hzb: 1
depth_of_sphere: 0.99745977
[2024-10-19T19:45:34Z INFO  renderling::cull::cpu::test]
[2024-10-19T19:45:34Z INFO  renderling::cull::cpu::test] name: yellow_cube_bottom_right
gid: 2
renderlet: Id(2982)
renderlet is inside frustum
znear: [0, 0, -1, 9.949975]
 zfar: [-0, -0, 1, 90.00072]
sphere_aabb: Aabb {
    min: Vec3(
        108.11314,
        108.11314,
        0.99745977,
    ),
    max: Vec3(
        122.8933,
        122.8933,
        0.9978464,
    ),
}
screen max dimension: 128
renderlet size in pixels: 20.902311
selected mip level: 4 8x8
center: [115.50322, 115.50322]
mip (x, y): (7, 7)
depth_in_hzb: 0.99471664
depth_of_sphere: 0.99745977
CULLED
[2024-10-19T19:45:34Z INFO  renderling::cull::cpu::test]
[2024-10-19T19:45:34Z INFO  renderling::cull::cpu::test] name: yellow_cube_bottom_left
gid: 3
renderlet: Id(3946)
renderlet is inside frustum
znear: [0, 0, -1, 9.949975]
 zfar: [-0, -0, 1, 90.00072]
sphere_aabb: Aabb {
    min: Vec3(
        5.106697,
        108.11314,
        0.99745977,
    ),
    max: Vec3(
        19.886864,
        122.8933,
        0.9978464,
    ),
}
screen max dimension: 128
renderlet size in pixels: 20.902311
selected mip level: 4 8x8
center: [12.49678, 115.50322]
mip (x, y): (0, 7)
depth_in_hzb: 0.99471664
depth_of_sphere: 0.99745977
CULLED
[2024-10-19T19:45:34Z INFO  renderling::cull::cpu::test]
[2024-10-19T19:45:34Z INFO  renderling::cull::cpu::test] name: floor
gid: 4
renderlet: Id(4130)
renderlet is inside frustum
znear: [0, 0, -1, 9.949975]
 zfar: [-0, -0, 1, 90.00072]
sphere_aabb: Aabb {
    min: Vec3(
        -388.54834,
        -349.92093,
        0.9998975,
    ),
    max: Vec3(
        516.54834,
        555.1758,
        1.002975,
    ),
}
screen max dimension: 128
renderlet size in pixels: 1280
selected mip level: 10 0x0
center: [64, 102.627426]
mip (x, y): (0, 0)
thread 'cull::cpu::test::occlusion_culling_debugging' panicked at /Users/schell/.cargo/registry/src/index.crates.io-6f17d22bba15001f/crabslab-0.6.1/src/lib.rs:38:6:
index out of bounds: the len is 21863 but the index is 4294967295
Much better! You can see that the bottom yellow cubes are being culled correctly.
HZB cull shader debugging on the CPU, selecting the correct mip level🔗
But computing culling on floor still causes a panic. This is because the
object itself is bigger than the viewport. Also of note is that its forward
depth is > 1!
So we need some special handling there.
We should bound the mip_level:
let mip_level = (size_in_pixels.log2().ceil() as u32).min(hzb_desc.mip.len() as u32);
After that, every draw call passes. So that fixes the panic.
But let's look at the green cube's print out:
[2024-10-19T20:11:16Z INFO  renderling::cull::cpu::test] name: green_cube
gid: 5
renderlet: Id(5094)
renderlet is inside frustum
znear: [0, 0, -1, 9.949975]
 zfar: [-0, -0, 1, 90.00072]
sphere_aabb: Aabb {
    min: Vec3(
        36.28719,
        36.28719,
        0.9946129,
    ),
    max: Vec3(
        91.712814,
        91.712814,
        0.9968867,
    ),
}
screen max dimension: 128
renderlet size in pixels: 55.425625
selected mip level: 6 2x2
center: [64, 64]
mip (x, y): (1, 1)
depth_in_hzb: 1
depth_of_sphere: 0.9946129
The green cube is behind the purple cube, so it should be culled, but it's
picking the last mip (level/index 6), which because of the max downsampling
contains all 1s, so no culling occurs.
We could change the mip_level calculation to use floor instead of ceil,
which then selects mip_level = 5 and samples at (2, 2).
This does result in the object being culled, but if we look at mip 5 at (2, 2)
we can see that it doesn't really match up with the AABB of the object:
Now, I'm not sure if this is acceptable. Conceptually it seems like we should be
sampling at one level deeper to cover the AABB, but other implementations I've
looked at seem to use floor, and this choice works in this test case, so I think
I'll just go with it, against my intuition about the concept. I can always change
it later if it gives weird results.
And that's the weekend! I'll post those results later.
Thu Oct 17, 2024🔗
Layer index atlas bug when repacking a texture🔗
This morning I fixed a bug in the texture atlas.
During re-packing if an existing image changed layers, a simple typo was preventing that layer from being updated to the new layer index.
It's a bad bug because repacking happens often: any time an image is added or removed.
It was a one line change.
Thanks to @firestar99 for finding that one 🙇.
Wed Oct 16, 2024🔗
Occlusion culling getting close🔗
I ran into a couple more hurdles, but the occlusion culling feature branch is finally compiling, running and passing existing tests. I don't know if it's actually working yet though, in that I don't have any tests that verify the occlusion culling.
So that's the next step. Writing unit tests and getting some screenshots, etc.
About those hurdles🔗
tl;dr - multisampling affects the depth buffer.
With MSAA on the depth buffer is multisampled. Not only does changing the sample count affect pipeline and bindgorup layouts, it determines the type of the depth image in any shader that uses it. This means I had to make two shaders - one for multisampling and one for not-multisampling.
Tue Oct 15, 2024🔗
Occlusion culling un-occluded🔗
So now that I finally have a proper depth pyramid
I can start working on the compute shader that will use the pyramid to "trim" the indirect draw
buffer. Bunny ears on "trim" because it doesn't filter/compact the buffer, it just sets the
instance_count field to 0.
Mon Oct 14, 2024🔗
I finally scaled the pyramid (or downsampled, I should say)🔗
So I side-stepped the pyramid of woes by moving the occlusion culling's depth pyramid to a storage buffer.
Then I needed to debug the downsampling shader. Turns out I had a couple checks backwards, and I had also
forgotten to reset the pyramid's mip_level back to zero after downsampling. The mip_level in
the pyramid descriptor determines which level we're currently downsampling into, and also
whether compute invocations continue, so that was causing the copy-depth-to-pyramid shader to
exit prematurely.
After fixing those issues I now have a nice-looking depth pyramid to use for culling:


Check out how it looks like the classic pixelated transition effect ;)
Sun Oct 13, 2024🔗
A pyramid of woes🔗
I'm still working on occlusion culling - just trying to get my shader operational (a simple one that copies a depth texture to the top of a depth pyramid).
When creating a ComputePipeline for my SPIR-V shader I'm getting this error:
wgpu error: Validation Error

Caused by:
  In Device::create_compute_pipeline, label = 'compute-occlusion-copy-depth-to-pyramid'
    Error matching shader requirements against the pipeline
      Shader global ResourceBinding { group: 0, binding: 2 } is not available in the pipeline layout
        Texture class Storage { format: R32Float, access: StorageAccess(STORE) } doesn't match the shader Storage { format: R32Float, access: StorageAccess(LOAD | STORE) }
but the texture in question can't be marked as write-only, as that's not possible in SPIR-V:
Sampled indicates whether or not this image is accessed in combination with a sampler, and must be one of the following values: 0 indicates this is only known at run time, not at compile time 1 indicates an image compatible with sampling operations 2 indicates an image compatible with read/write operations (a storage or subpass data image).
The texture in question is defined as %37 = OpTypeImage %float 2d 0 0 0 2 r32f.
I had thought that providing the access qualifier would tell wgpu that the texture is write-only, but that was a wild goose chase.
I guess I should use 0 for "Sampled" (the second to last value in OpTypeImage)?
No, because that fails spir-val: error: [VUID-StandaloneSpirv-OpTypeImage-04657] Sampled must be 1 or 2 in the Vulkan environment.
So, the SPIR-V spec for OpImageWrite says:
Image must be an object whose type is OpTypeImage with a Sampled operand of 0 or 2.
But using 0 seems to fail spir-val, and using 2 passes spir-val's validation, but fails wgpu's validation with the above error.
Is this a bug? Or maybe I'm just not doing it right?
...
I found this issue, which is illuminating, but doesn't offer any plan of action. If I read it correctly.
Back to the pyramid-on-a-buffer🔗
I relayed the same thing above^ to the wgpu matrix channel, but
nobody has responded, and as usual I have to prioritize and triage my effort, so I'm going back to storing the
pyramid on the slab instead of using textures.
...
Sat Oct 12, 2024🔗
rust-gpu Image access🔗
I opened an issue to add AccessQualifier to Image in Rust-GPU.
Resolving that should result in my pyramid-copy-depth shader being usable from wgpu.
But resolving that... ...is going to have to come from me, I'm afraid, lol.
...⏱️
Ok so I'm attempting to cargo build the rust-gpu repo and am hitting a segfault, so now I'm using lldb
to debug rustc...
...not to much avail. There are a lot of arguments and env vars that cargo sets that make it difficult to
debug rustc directly.
I'm thrashing by installing all macOS updates and restarting, then doing a cargo clean...
...⏱️
My PR to fix the depth texture sampling problem in naga merged!
And my PR to add AccessQualifier to Image in rust-gpu is ready.
So I should be able to write this occlusion culling now, lol.
Thu Oct 10, 2024🔗
I'm running with a patched version of naga until my PR to fix the depth texture sampling problem
gets merged. Well - I'll still be running witha patch until that stuff and my atomics work hits crates.io.
So, let's do some occlusion culling!
Workin' at the pyramid 🔻🔗
I think that now that I can use depth textures, I might just go the more traditional route of storing the pyramid in actual texture mips...
...⏱️
Ugh!
According to the WGSL spec:
Depth textures only allow read accesses.
Blarg. That means I can't use depth textures for the pyramid, because I have to read and write them.
I'll have to change them to R32Float so I can write to them, which means writing one more shader to copy
the depth texture to the top level of the pyramid.
I've written the shaders using these image types here:
pub type DepthImage2d = Image!(2D, type=f32, sampled=true, depth=true);
pub type DepthPyramidImage = Image!(2D, format = r32f, sampled = false, depth = false);
...but compilation errs in SPIR-V validation with:
error: error:0:0 - Expected Image 'Sampled' parameter to be 1
         %114 = OpImageFetch %v4float %113 %110 Lod %111
I guess you can only fetch from sampled images, and can only write to non-sampled images.
This effectively means that an image must either be read-only or write-only.
So now I have these image types:
pub type DepthImage2d = Image!(2D, type=f32, sampled=true, depth=true);
pub type DepthPyramidImage = Image!(2D, format = r32f, sampled = true, depth = false);
pub type DepthPyramidImageMut = Image!(2D, format = r32f, sampled = false, depth = false);
Which compiles. Phwew.
Now does it validate in naga?
Ugh. I have to fix errors on the CPU side before I can run the tests, lol.
It looks like the latest wgpu changed somethings.
Most notably that shader entry points and render/compute pass bindings are optional.
...⏱️
One of the shaders validates. The one that copies the depth to the top of the pyramid.
The downsampling shader doesn't validate, because it has an "Inappropriate sample or level-of-detail index for texel access".
I've been using fetch_with using a level-of-detail 0. So I guess I'll try just
using fetch?
...⏱️
Ok, that did it. Odd. I've found that working with graphics APIs are often like this. I should figure out exactly why, but that's a distraction I get revisit later.
...⏱️
Rust-Gpu image read/write woes🔗
I'm having trouble getting my copy-depth pipeline layout to match the shader.
The shader expects the mip to be a read/write storage texture, but WebGPU only
allows write-only storage textures. I can't seem to figure out how to have my
shader specify that the image is write-only. Indeed there does not seem to
be a way to express this in the
Image type.
Looks like I'll have to open an issue.
Wed Oct 9, 2024🔗
I submitted a PR to fix the depth texture sampling problem in naga.
It's odd though, because the technique I employed fixes sampling (with a sampler), but fetching/loading still seems not to validate. I'm pretty sure it's ok to load from a depth texture, though.
I'll have to find the relevant parts in the WGSL spec or something.
Going deeper on sampling depth textures🔗
So on the fix branch above^ it looks like the snapshot test for shadow.spv is failing validation.
It's expecting that some function return a scalar, but now it's returning a vector.
That tracks because I've changed depth texture loads/samples to splat their return value, since WGSL expects sampled depth textures to return vectors, but SPIR-V expects them to return scalars.
The exception is that in the case of the SPIR-V ops OpImageSampleDrefExplicitLod or OpImageSampleDrefImplicitLod,
the result type must be a scalar.
So the fix is easy then, check if there's a "dref" in the parsed image op and only splat if we can't find one.
Tue Oct 8, 2024🔗
I've been working on extending the pre-render culling phase by adding occlusion culling.
The algorithm roughly goes like this:
create a mipmap pyramid of the depth texture
get the screen-space AABB of each object
for each AABB, fetch the depth of the pyramid at the level where one pixel covers as much space as the AABB
if the depth is less than that of the aabb, cull
This would involve at least two shaders, one to generate the depth pyramid and one to do the culling.
I'm still working on generating the depth pyramid and so far it's been pretty painful, mostly because
the SPIR-V support in naga for working with depth textures is not up to par.
After a bunch of thrashing, I landed on an implementation that sidesteps a lot of the depth texture stuff.
Instead of using a bunch of mipmaps, I represent the pyramid by an array of
arrays that I can hold in a storage buffer, using crabslab.
I still need to copy the depth texture to the top level of the pyramid, though, and that's where I'm running into trouble. It just doesn't seem possible for naga to validate SPIR-V shaders that sample a depth texture.
I found a very on-topic pre-existing naga issue.
Sat Sep 28, 2024🔗
Today I'm digging into the real meat 🍖 of polishing frustum culling, and hopefully wrapping that up with enough time to get to occlusion culling as a stretch goal.
Let's see how it goes.
...⏱️
My ADD strikes again.
Header links!🔗
On this website you should now see a "section link" (🔗) to the right of h1, h2 and h3 headers when you mouse over them, or tap on them on mobile. You and I can use them to link to a specific section of the devlog (but mostly I will be using them to link to a specific section of the devlog 😉).
Oh, by the way - if anyone is interested in the static site pushing code that is used on this website, you can check it out here: https://github.com/schell/pusha.
And if you're interested in the markdown parsing and HTML generation code that is used on this website, you can check it out here: https://github.com/schell/renderling.xyz.
Logo stuff!🔗
But first I'm going to fix the logo in the README, because after briefly considering paying for a logo, I've changed it to the "happy daddy troll":

This is a pixel art troll I had made to test a feature in an old hand-made engine, "Old Gods", which is defunct. But the troll itself is a strong, happy caretaker - which is what I try to be, so I've been using him as my discord profile image for years and I thought "why not just use that as the logo"? I had meant to do some modelling in Blender to upgrade him from pixel art to real 3d so why not use this in the meantime and make the upgrade official renderling business?
I like the troll, he resonates with me and so I think I'll just keep using this asset.
I made this switch after Michiel Leenaars suggested that the "meat-on-bone" emoji wasn't quite up-to-snuff as the project's logo, which of course is correct.
There are a few places where the meat-on-bone emoji is still kicking around though.
Actual frustum culling.🔗
Ok, back to actually working on frustum culling...
...⏱️
So... ...in the glTF viewer the camera is constructed with an infinite, right-handed perspective projection matrix. This did indeed mess up the the frustum culling shader.
But why is kinda interesting.
It's easy to see that using this infinite, right-handed projection would result in a
view frustum with a far plane (zfar) that is infinitely far away. That's the point,
really. When we use this projection we don't want to cull anything in front of the
camera. But the problem is that using this projection to construct the frustum in
the compute-culling shader results in a frustum with inf and NaN values, which
crash the shader. We don't get any info about this crash either, because it's on the
GPU.
There are at least two ways to fix this.
Don't use
Mat4::perspective_infinite_*.Sanitize the frustum construction.
I'm going to investigate 2, as it's a better developer experience.
...⏱️
So the frustum construction function looks like this (some details omitted):
        pub fn from_camera(camera: &Camera) -> Frustum {
            let viewprojection = camera.projection * camera.view;
            let mvp = viewprojection.to_cols_array_2d();

            let left = normalize_plane(Vec4::new(
                mvp[0][0] + mvp[0][3],
                mvp[1][0] + mvp[1][3],
                mvp[2][0] + mvp[2][3],
                mvp[3][0] + mvp[3][3],
            ));

            // ... omitted for brevity

            let fplane = Vec4::new(
                -mvp[0][2] + mvp[0][3],
                -mvp[1][2] + mvp[1][3],
                -mvp[2][2] + mvp[2][3],
                -mvp[3][2] + mvp[3][3],
            );
            let far = normalize_plane(fplane);

            // ...

            Frustum {
                planes: [near, left, right, bottom, top, far],
                points: [nlt, nrt, nlb, nrb, flt, frt, flb, frb],
            }
        }
In our case the values are:
fplane = Vec4(0.0, 0.0, 0.0, 4.0)far = Vec4(NaN, NaN, NaN, inf)
...and attempting to calculate these inf and NaN values crashes the shader.
It's also important to note that I'm going to assume it doesn't matter which way the
camera is pointing, fplane should always contain a non-zero x, y or z unless
it's an infinite projection. We'll have to check later with an orthogonal projection.
Ok, so here's our normalize_plane function:
/// Normalize a plane.
pub fn normalize_plane(mut plane: Vec4) -> Vec4 {
    let normal_magnitude = (plane.x.powi(2) + plane.y.powi(2) + plane.z.powi(2)).sqrt();
    plane.x /= normal_magnitude;
    plane.y /= normal_magnitude;
    plane.z /= normal_magnitude;
    plane.w /= normal_magnitude;
    plane
}
It seems like a good place to check if normal_magnitude is zero, and if so, make it some
very minimal value instead. So I'll do this instead:
    let normal_magnitude = (plane.x.powi(2) + plane.y.powi(2) + plane.z.powi(2))
        .sqrt()
        .max(f32::EPSILON);
This seems to get us further. Now we have:
fplane = Vec4(0.0, 0.0, 0.0, 4.0)far = Vec4(0.0, 0.0, 0.0, 33554432.0)
So far so good? Except that far is supposed to be a plane, which is a unit vector
and a scalar distance from the origin, and (0, 0, 0) is not a unit vector.
Indeed, we get a bunch of inf in the resulting frustum:
Frustum {
        planes: [
            Vec4(
                -0.2182179,
                -0.8728716,
                -0.4364358,
                20.91288,
            ),
            Vec4(
                0.74283457,
                -0.33403352,
                -0.5801882,
                8.76838,
            ),
            Vec4(
                -0.9098514,
                -0.33403355,
                0.24615471,
                8.768381,
            ),
            Vec4(
                -0.44415402,
                0.116773516,
                -0.88830805,
                8.76838,
            ),
            Vec4(
                0.27713725,
                -0.7848406,
                0.5542745,
                8.76838,
            ),
            Vec4(
                0.0,
                0.0,
                0.0,
                33554432.0,
            ),
        ],
        points: [
            Vec3(
                3.4992118,
                18.65849,
                8.850844,
            ),
            Vec3(
                4.9811487,
                18.658491,
                8.109876,
            ),
            Vec3(
                4.1459827,
                17.850029,
                10.144382,
            ),
            Vec3(
                5.6279173,
                17.850029,
                9.403414,
            ),
            Vec3(
                -inf,
                -inf,
                -inf,
            ),
            Vec3(
                -inf,
                -inf,
                -inf,
            ),
            Vec3(
                -inf,
                -inf,
                inf,
            ),
            Vec3(
                -inf,
                inf,
                inf,
            ),
        ],
    }
As you can see, all the far plane's corner points are inf, when what we want is for
them to be f32::MAX or f32::MIN.
Now, I have an intuition that the near and far planes are mirrors of each other. At
least it seems that way geometrically. So I think we can simply take the xyz
components of the near plane, invert it, and then take the distance from the origin
to the far plane to get a representable far plane:
let final_far = (-1.0 * near.xyz()).extend(far.w);
And that does it! Now the four corners of the far plane are:
Vec3(
    -25179066.0,
    -22506832.0,
    -19279666.0,
),
Vec3(
    -316292.97,
    -22506834.0,
    -31711054.0,
),
Vec3(
    -14328063.0,
    -36070588.0,
    2422342.3,
),
Vec3(
    10534711.0,
    -36070588.0,
    -10009045.0,
)
Big numbers, expectedly. Let's see if that helps.
...
Well, it looks like the constructed frustum can be used as a mesh, so we know the shader can handle those big numbers (they didn't seem all that big, anyway).
Here's a video of the example-culling app displaying the infinite frustum. AABBs that should be culled are shown in red and visible AABBs are blue.
Looks okay. So now let's recompile the shaders and see what happens with Sponza.
Ew. 😭.
It almost looks backwards, but not quite.
Let's look at the shader again.
pub fn compute_frustum_culling(
    #[spirv(storage_buffer, descriptor_set = 0, binding = 0)] slab: &mut [u32],
    #[spirv(storage_buffer, descriptor_set = 0, binding = 1)] args: &mut [DrawIndirectArgs],
    #[spirv(global_invocation_id)] global_id: UVec3,
) {
    let gid = global_id.x as usize;
    if gid >= args.len() {
        return;
    }

    // Get the draw arg
    let arg = unsafe { args.index_unchecked_mut(gid) };
    arg.instance_count = 1;

    // Get the renderlet using the draw arg's renderlet id
    let renderlet = slab.read_unchecked(arg.first_instance);
    if renderlet.bounds.is_zero() {
        return;
    }
    let camera = slab.read(renderlet.camera_id);
    let model = slab.read(renderlet.transform_id);
    if renderlet.bounds.is_outside_camera_view(&camera, model) {
        arg.instance_count = 0;
    }
}
Aabb::is_outside_camera_view isn't the function we're using in the example-culling app.
In the example-culling app we're using Aabb::is_outside_frustum.
So the problem is probably in Aabb::is_outside_camera_view before calling Aabb::is_outside_frustum.
Here's Aabb::is_outside_camera_view:
pub fn is_outside_camera_view(&self, camera: &Camera, transform: Transform) -> bool {
    let transform = camera.projection * camera.view * Mat4::from(transform);
    let min = transform.project_point3(self.min);
    let max = transform.project_point3(self.max);
    Aabb::new(min, max).is_outside_frustum(camera.frustum)
}
So now I'm thinking that rotating the Aabbs is not happening as I expect. Let's add
that to the example-culling app so we can visualize what's happening.
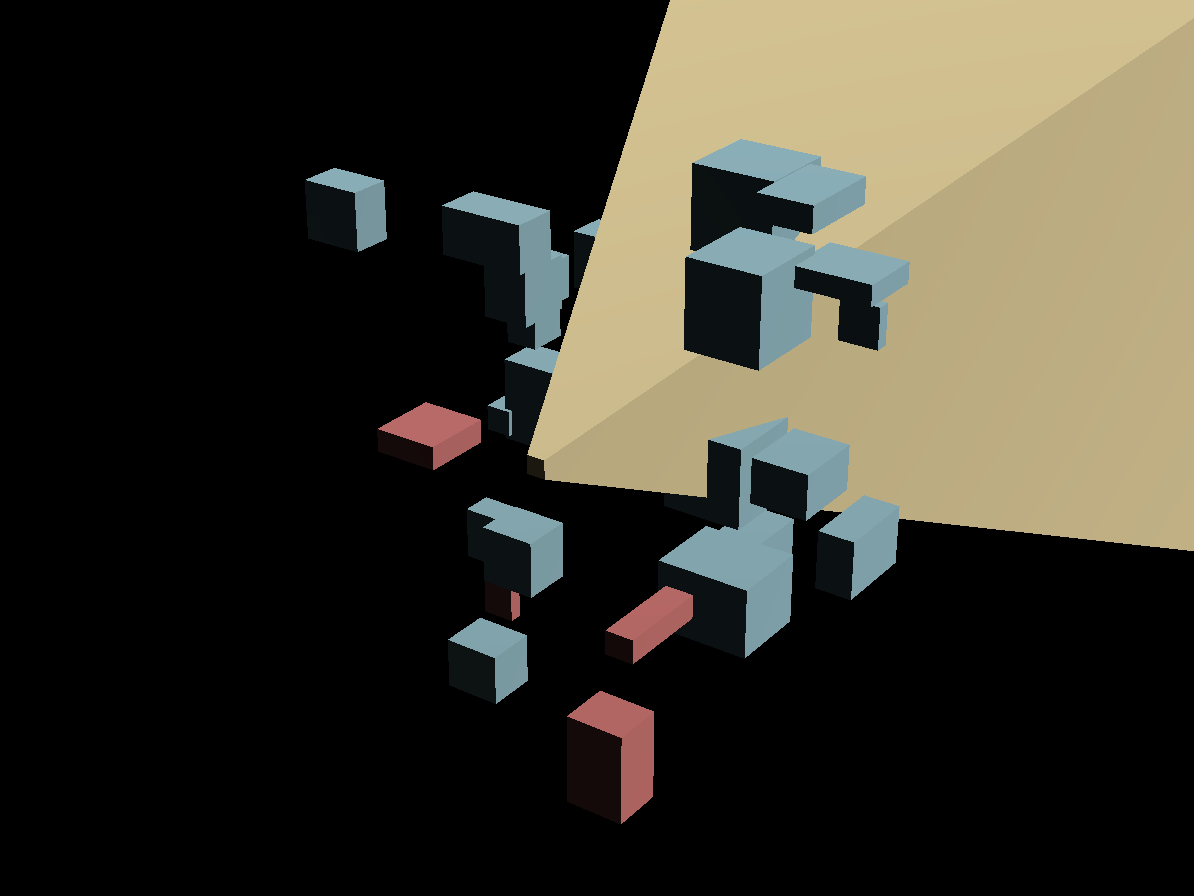
So above you can see that even without a rotation happening, the transformation step is
causing havok. Aabbs that should be outside are colored as if inside and vice versa,
though it's not even an inversion of correct behavior.
Wait!
Oof. It's the coordinate system. The frustum is in world coordinates, and the transform we're doing puts the AABB corners into clip space.
The correct implementation of is_outside_camera_view should be:
pub fn is_outside_camera_view(&self, camera: &Camera, transform: Transform) -> bool {
    // Here we don't need to multiply by camera.projection * camera.view, because
    // we want the AABB in world space.
    let transform = Mat4::from(transform);
    let min = transform.transform_point3(self.min);
    let max = transform.transform_point3(self.max);
    Aabb::new(min, max).is_outside_frustum(camera.frustum)
}
Indeed, that works now:
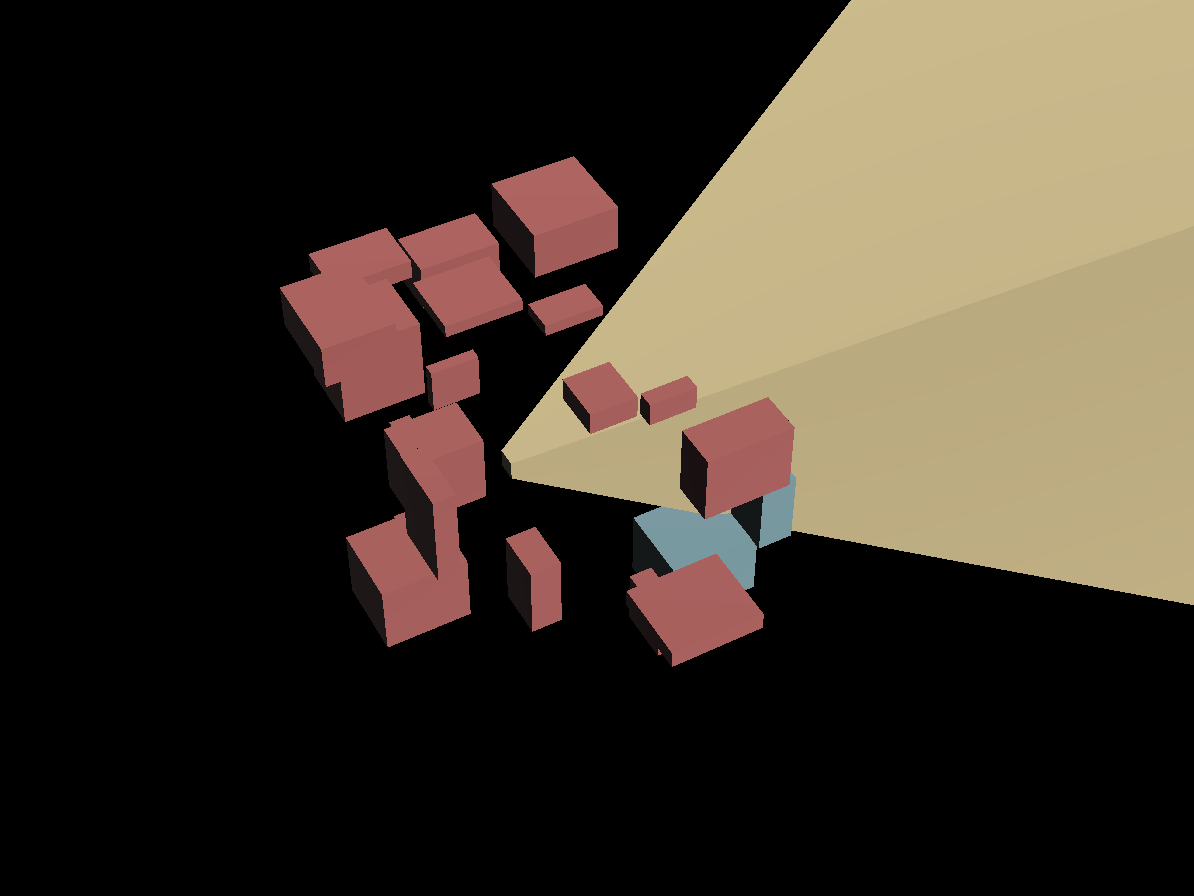
So now let's add in rotation to our example-culling app to ensure that's working:
That seems to work!
A frustum-culling "corner case"🔗
There is one AABB in the first group that has a corner inside the frustum, even though it's marked as outside, so that's not good, but it's a great improvement for an afternoon's work.
I bet that (literal) "corner case" is caused by our infinite perspective matrix fix...
...nah, it happens even with a small frustum. So it's the hit testing code. I'll debug that later. I made a ticket.
Now let's rebuild the shaders and take a look at Sponza.
Sweet as! It's like night and day.
Interestingly, and expectedly - the speedup of frustum culling depends on where you're looking. When you look down at the ground the FPS jumps up to 61! If I'm looking at the lion statue, it goes down to around 25. So definitely a lot of room for improvement.
GPU capture after frustum culling🔗
Now let's see how much time we're really saving with the naive frustum culling.
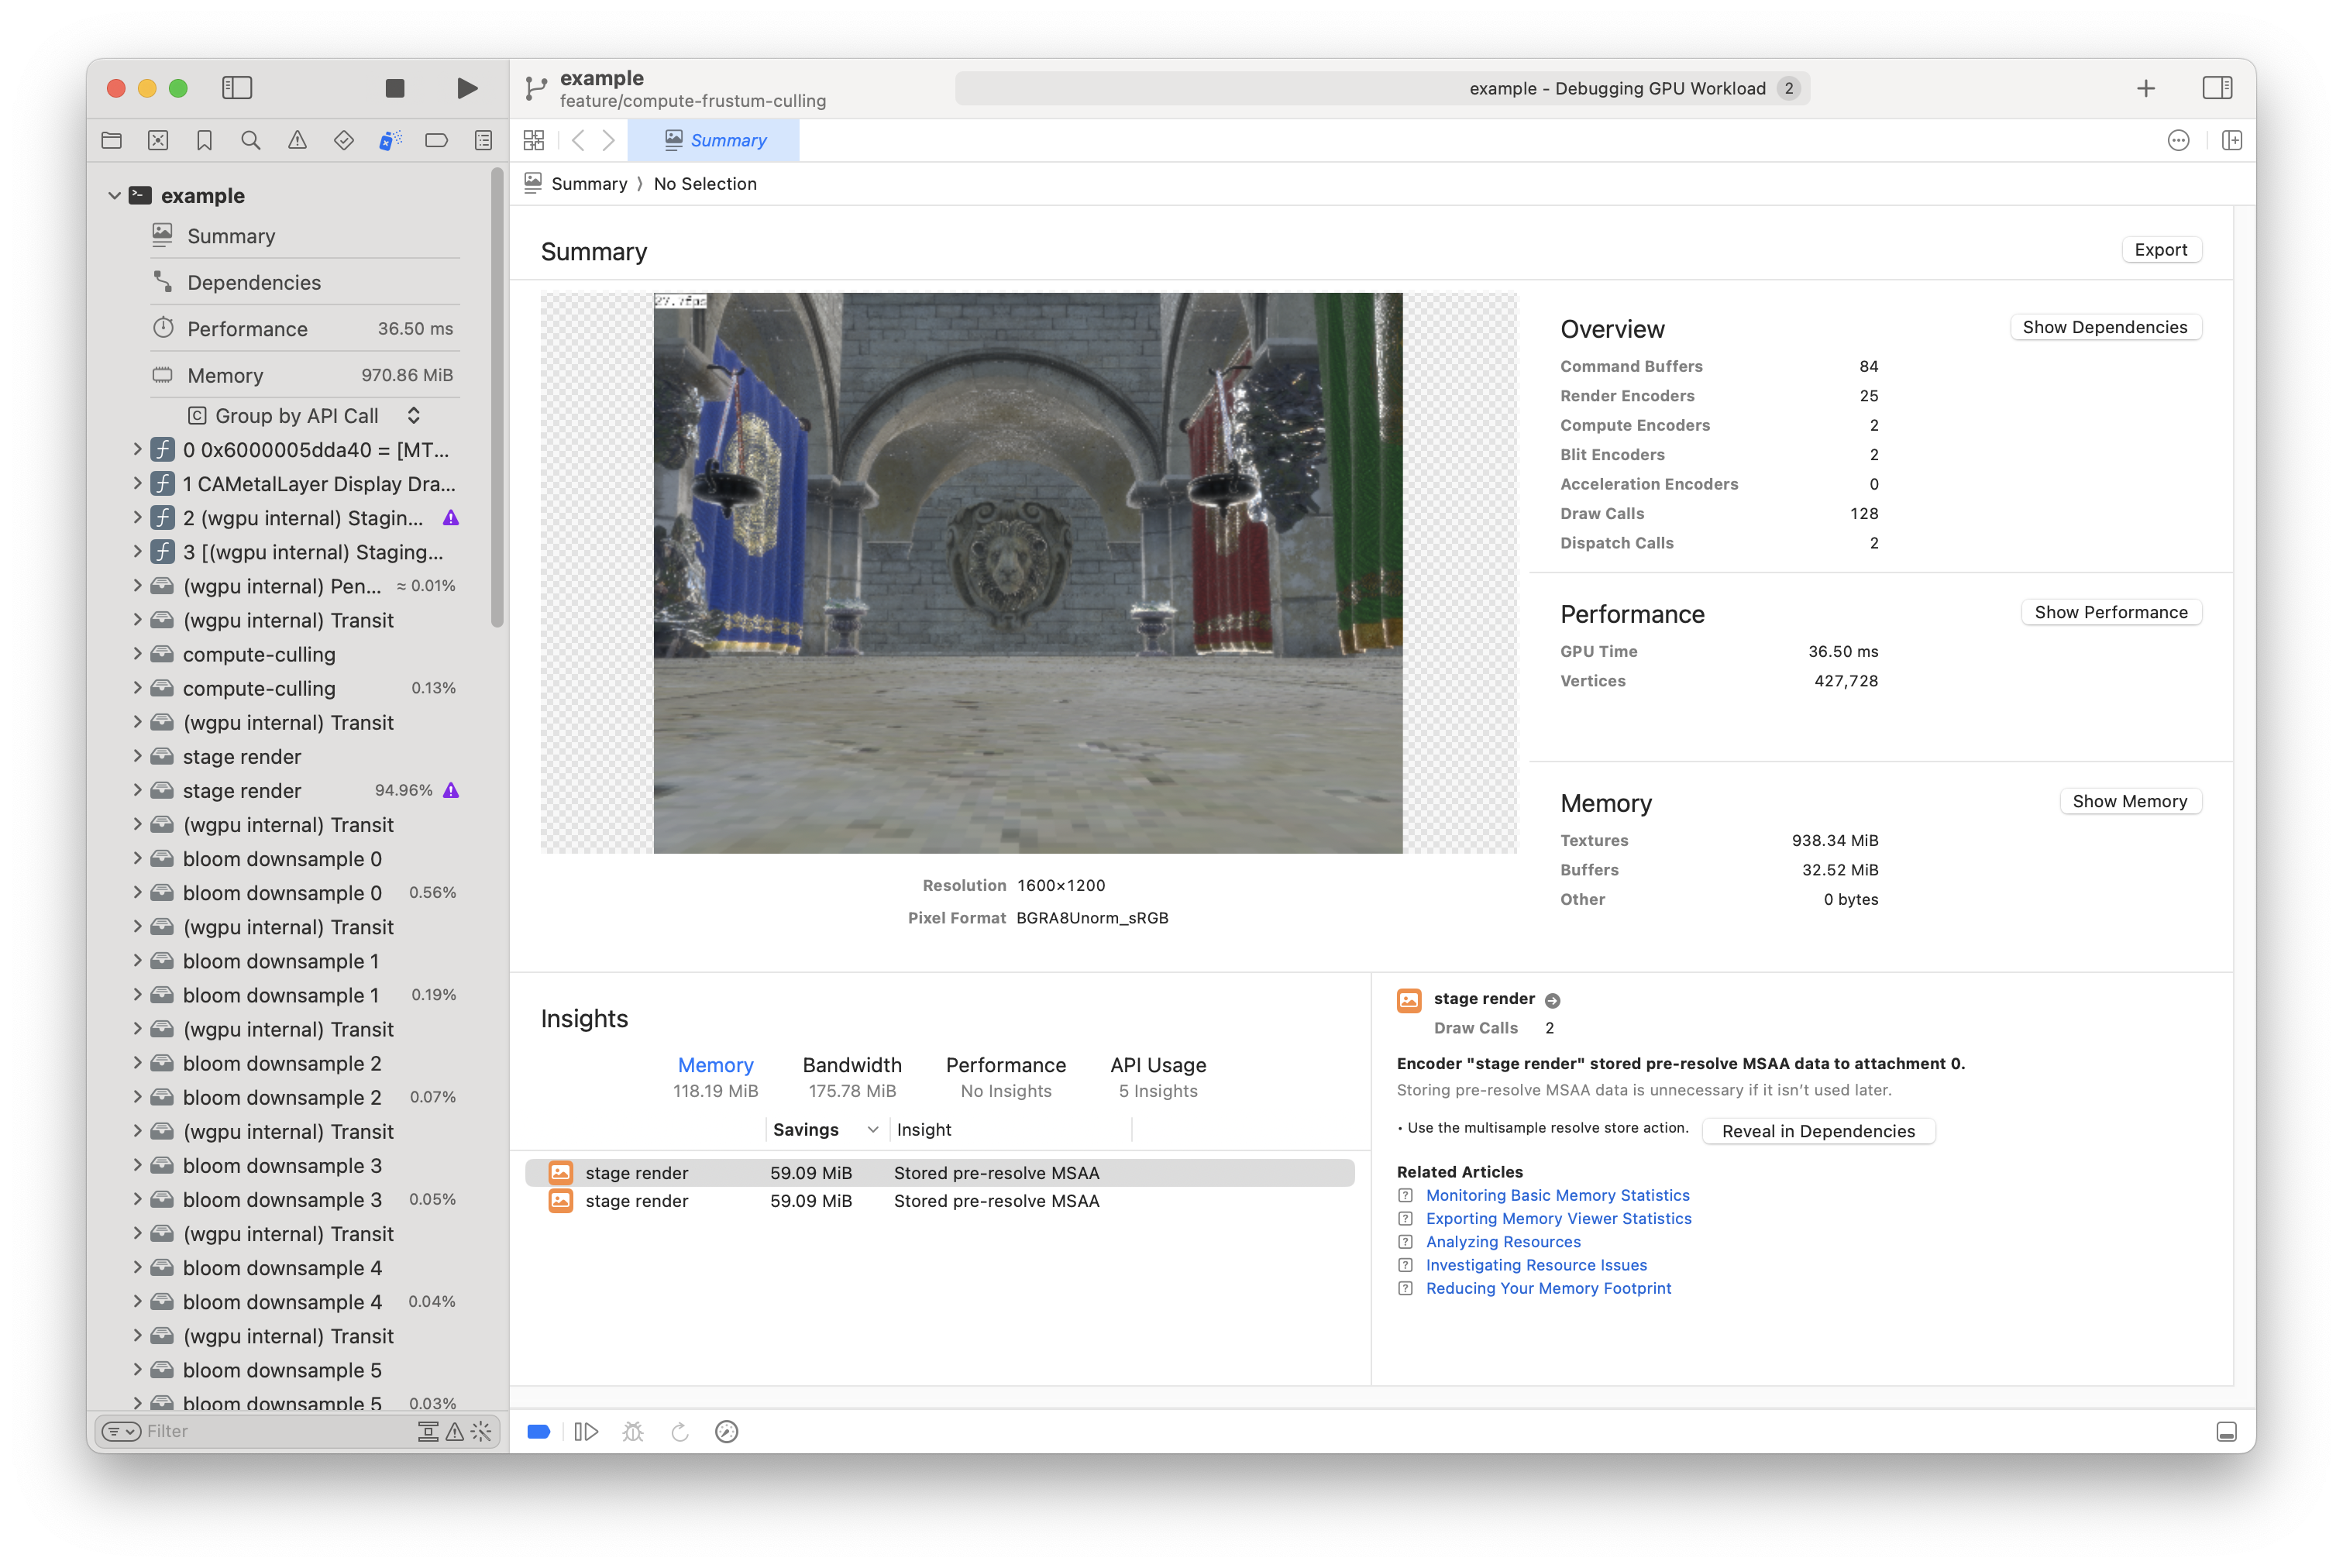
So previously ~55ms and now ~37ms. Still about a 30% reduction, but I purposefully captured a frame while looking in the direction of the most intricate geometry.
Frustum culling last debugging - Camera🔗
I'm debugging some tests that have broken on the feature/compute-frustum-culling branch.
The first issue is with Camera.
When a Camera is created with Camera::new, the position and frustum are calculated
from the projection and view, and cached in those aptly named fields.
The same thing happens when you update the projection or view using a number of functions.
But if you construct a Camera using struct syntax, position and frustum are never
calculated.
This has unexpected effects inside our shaders.
There's a couple ways to fix this. I'm leaning towards making position and frustum
private fields, that way you must use Camera::new, but that still won't help the
situation camera.projection = _, which results in an incorrect position and frustum.
Maybe all the fields should be private? I don't know why I have a knee-jerk reaction against that. That's probably the fix...
I think I don't like it just because it makes the API lop-sided. But that's aesthetic.
Ok, I'm going to do that. This is a breaking change, unfortunately, I guess, though the library isn't popular enough to really be worried about that.
Frustum culling last debugging - AABB vs Frustum corner case🔗
Let's figure out what's going on with this "corner case":
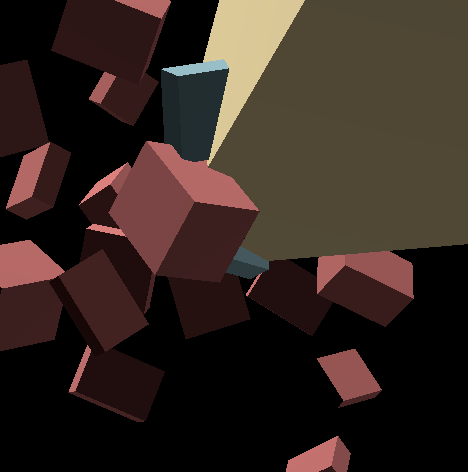
And you can see from the inside of the frustum that the corner is poking through, and yet that AABB is marked as red, which means "should be culled".
Obviously this is bad because it would result in geometry being erroneously culled.
Here's the view from within the frustum:
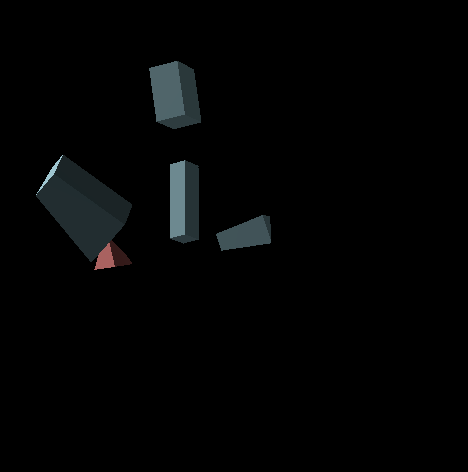
Which clearly shows the "corner case" ;) So let's get exactly which AABB that is.
...
Ha! It's the very first one.
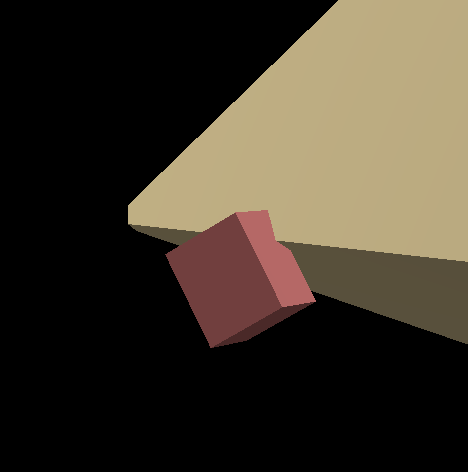
Let's write a unit test.
We've got these values for the AABB (and its transform):
Aabb { min: Vec3(-3.2869213, -3.0652206, -3.8715153), max: Vec3(3.2869213, 3.0652206, 3.8715153) }
Transform { translation: Vec3(7.5131035, -9.947085, -5.001645), rotation: Quat(0.4700742, 0.34307128, 0.6853008, -0.43783003), scale: Vec3(1.0, 1.0, 1.0) }
And the camera, which constructs the frustum:
let aspect = 1.0;
let fovy = core::f32::consts::FRAC_PI_4;
let znear = 4.0;
let zfar = 1000.0;
let projection = Mat4::perspective_rh(fovy, aspect, znear, zfar);
let eye = Vec3::new(0.0, 0.0, 10.0);
let target = Vec3::ZERO;
let up = Vec3::Y;
let view = Mat4::look_at_rh(eye, target, up);
Camera::new(projection, view)
From this we should be able to write a unit test and start poking around.
...
Here's our failing unit test:
let camera = {
    let aspect = 1.0;
    let fovy = core::f32::consts::FRAC_PI_4;
    let znear = 4.0;
    let zfar = 1000.0;
    let projection = Mat4::perspective_rh(fovy, aspect, znear, zfar);
    let eye = Vec3::new(0.0, 0.0, 10.0);
    let target = Vec3::ZERO;
    let up = Vec3::Y;
    let view = Mat4::look_at_rh(eye, target, up);
    Camera::new(projection, view)
};
let aabb = Aabb {
    min: Vec3::new(-3.2869213, -3.0652206, -3.8715153),
    max: Vec3::new(3.2869213, 3.0652206, 3.8715153),
};
let transform = Transform {
    translation: Vec3::new(7.5131035, -9.947085, -5.001645),
    rotation: Quat::from_xyzw(0.4700742, 0.34307128, 0.6853008, -0.43783003),
    scale: Vec3::new(1.0, 1.0, 1.0),
};
assert!(
    !aabb.is_outside_camera_view(&camera, transform),
    "aabb should be inside the frustum"
);
...⏱️⏱️⏱️
Ah. Shoot. 🤦. You may have caught this way before I did.
When you rotate an AABB, you can't simply take its rotated min and max values and create a new AABB, because the other two corners may have smaller and larger components. To properly enclose all corners you have to min/max all of them.
Here's a screenshot of the same frustum culling demo, but we also draw the erroneous AABBs that I thought would enclose the transformed objects:
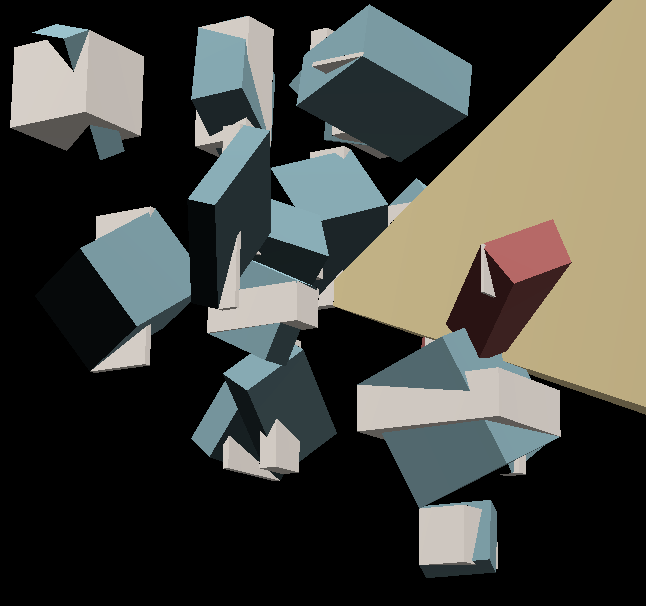
It's obvious from the screenshot that the calculated AABBs (shown in white) don't enclose all corners of the transformed AABBs. You can even see that one pesky AABB that started this whole "corner case" - its white AABB obviously not intersecting the frustum.
This is just an embarrassing oversight on my part. So instead of calculating
the AABB of the transformed AABB of the object, I think we should go with a
bounding sphere. The other engines do this, and it makes sense. It also means
we store less data on the GPU (one less f32 per draw call).
Frustum culling - Bounding spheres🔗
I'm changing the gltf import code to use a bounding radius and center instead of an AABB, and then doing the same in the culling code.
That does it.
You can see from the video that using a bounding sphere is more conservative in what it culls. This means we'll have less of an FPS boost, but it will be correct!
I have a feeling that occlusion culling will really help out on the Sponza scene.
That's a wrap on frustum culling🔗
I called this "naive" frustum culling, but that's really about all there is to the algorithm. Don't get me wrong, this took plenty of time (my whole weekend). I didn't get to try out occlusion culling yet, which is the next step, but I will later.
Occlusion culling is not part of this milestone, and I have limited time on my grant project to hit the other milestones (specifically light tiling). So I can circle back to this later.
How rust-gpu helped me with frustum culling
I almost forgot to mention that this is a great example of how much it helps to have the same language used on each side of the CPU/GPU barrier. Here because my project uses Rust on both sides, I was able to set up an example app that excercises GPU code on the CPU, showing me exactly what the problem is, visually.
Fri Sep 27, 2024🔗
The (very) naive frustum culling implementation shows around a 30% reduction in GPU time while rendering Sponza - previously ~55ms and now ~38ms. That's pretty good. The target is to reduce the GPU time enough to get an entire frame down to 16ms. I'm confident I can do better than 38ms.
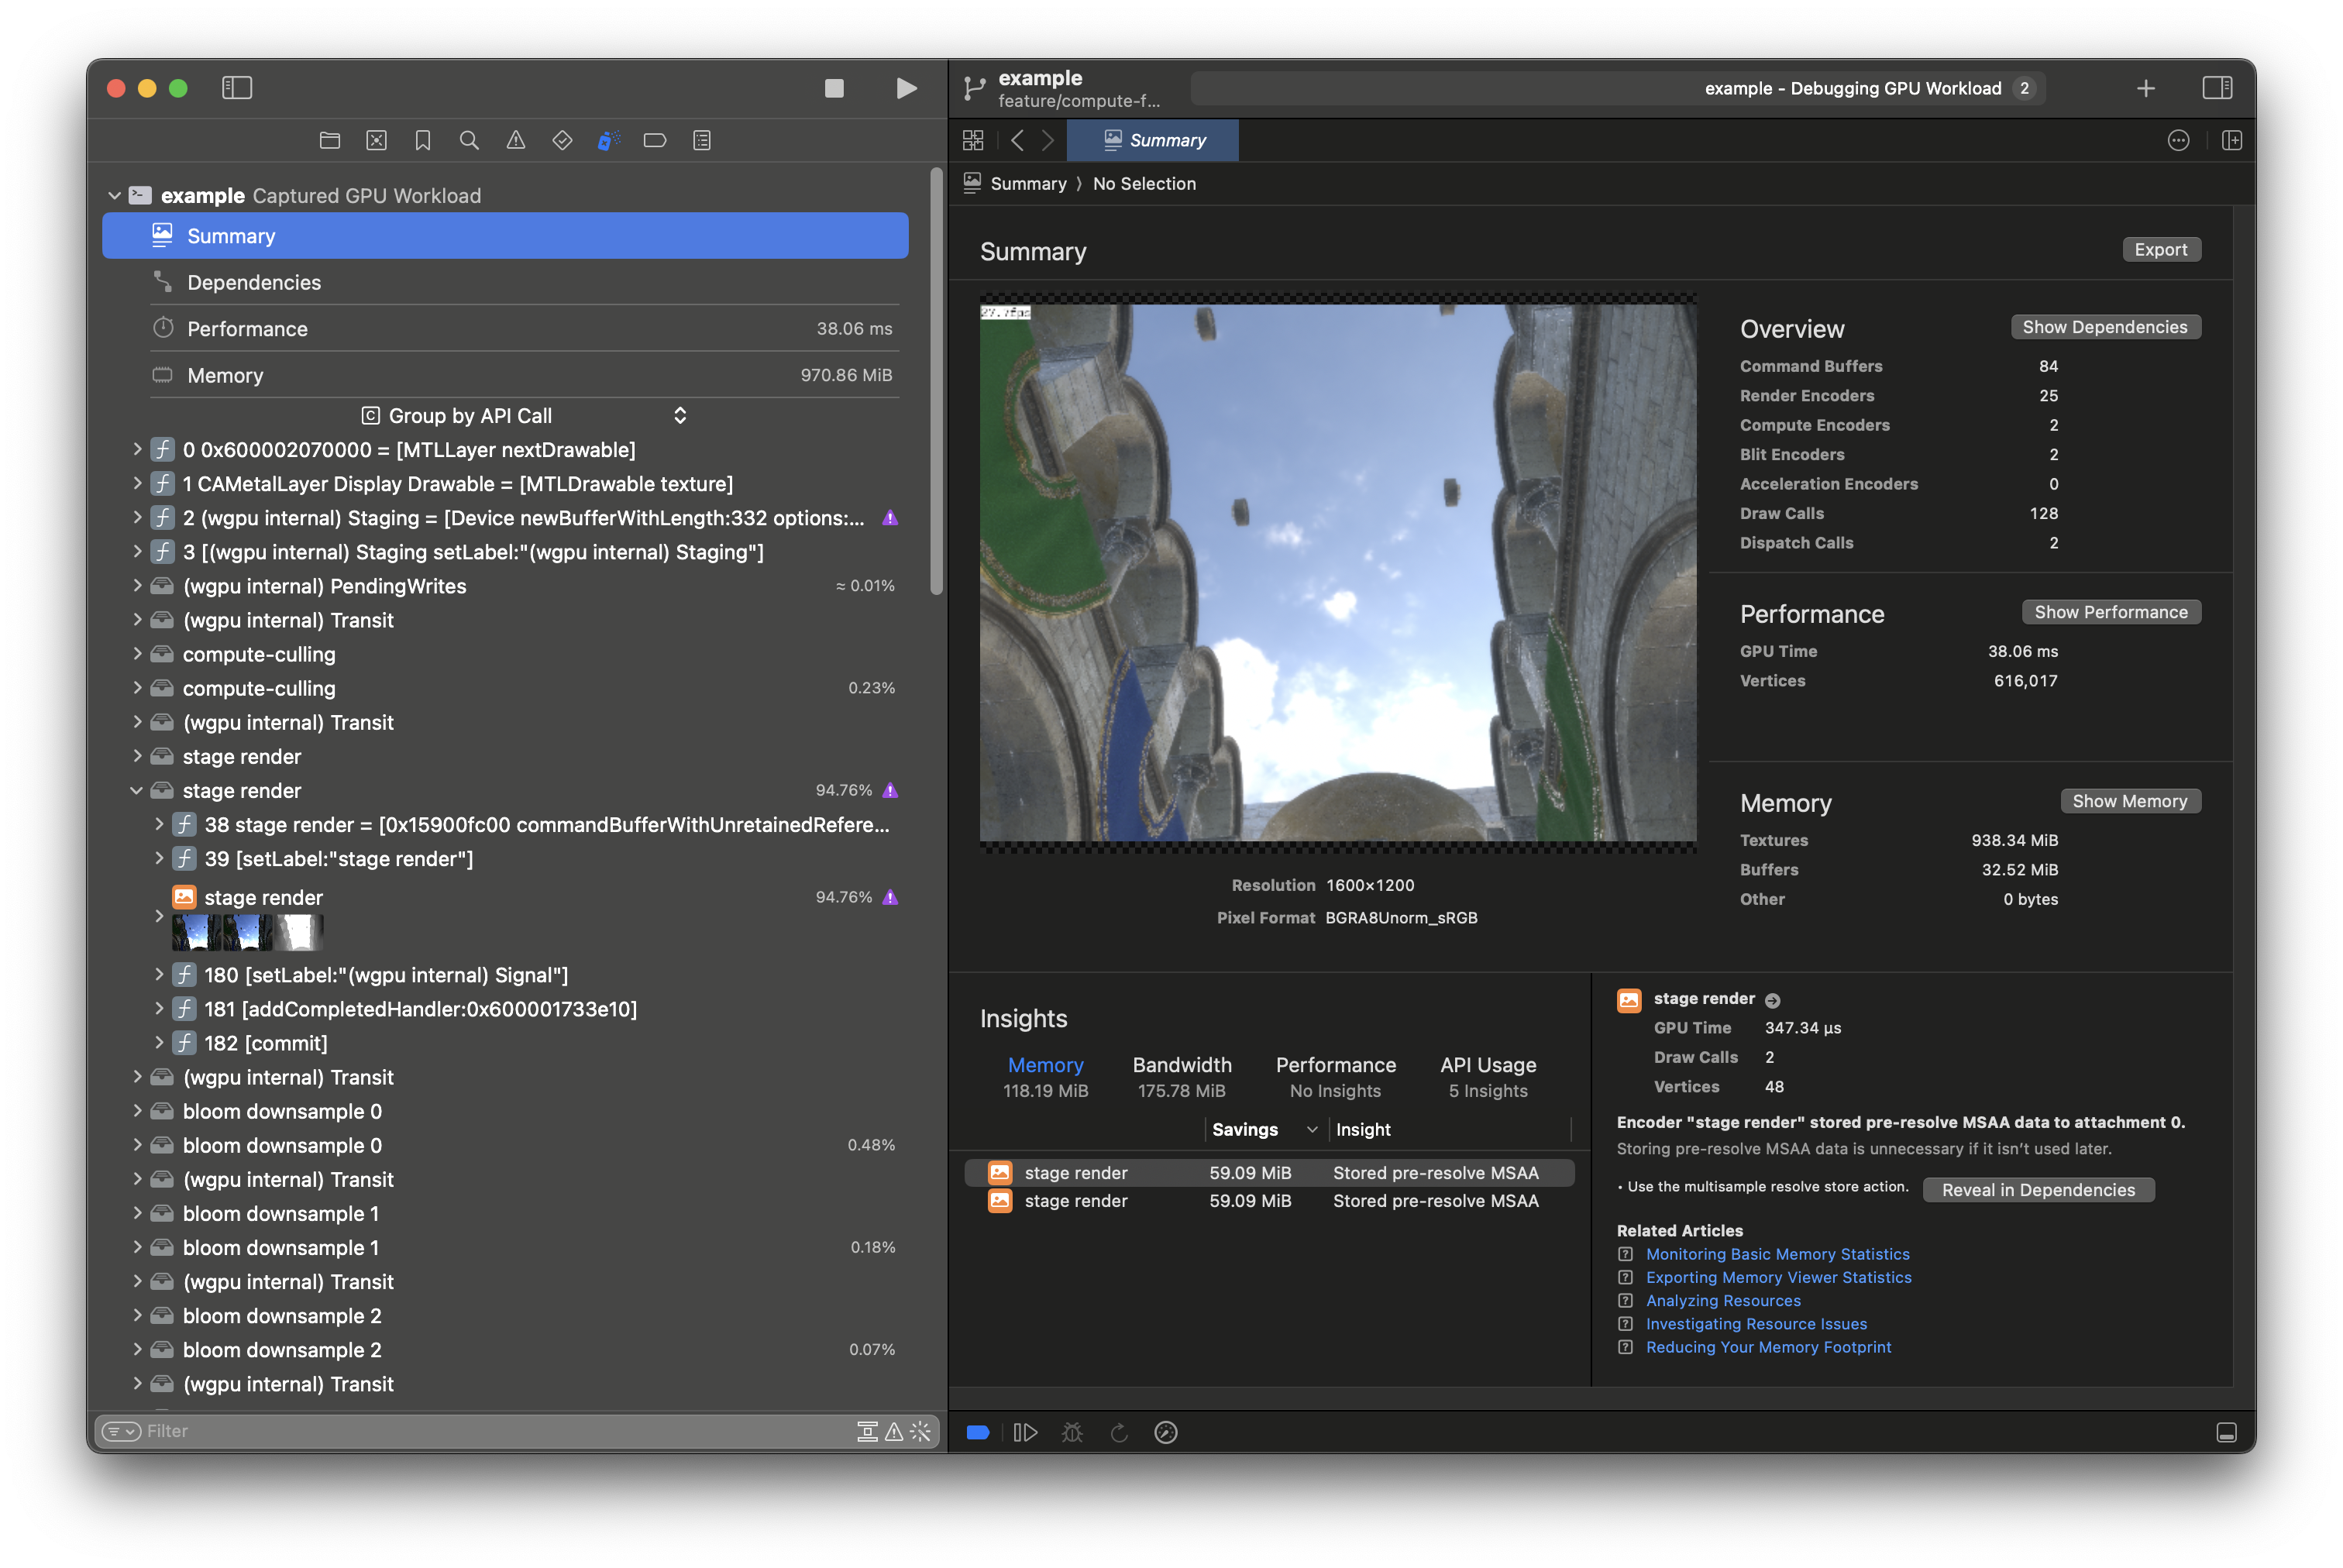
You can see here though, that the roof is erroneously being culled.
So I set up a test application that draws a frustum and then tests it against randomly generated Aabbs, hoping to find if there are any obvious mistakes.
Nothing obvious.
But then I remembered that the frustum is being calculated from the Camera, and
the camera used in the example glTF viewer (the app being profiled above), uses a
Mat4::perspective_infinite_rh projection matrix. This is not what the function that calculates the
frustum expects, and so I think that's where things are screwy. We'll see tomorrow morning.
Wed Sep 25, 2024🔗
Updating my macOS worked. Now it seems I can capture GPU frames more reliably. Oddly enough, Xcode is still launching two (sometimes three) executables at a time, lol.
Here's the Sponza model GPU frame capture synopsis:
So now that I can see that Stage::render's main multi_draw_indirect call is
the one taking up ~90% of the GPU work, I can finish frustum culling and see
how much that helps.
I might be able to get as far as occlusion culling, which would help in the case that a really big model is inside the frustum. I'm interested how an occlusion culling algo determines if a mesh in front contains holes that might show an otherwise occluded mesh in the back...
Towards frustum culling🔗
Bounding box
The first step is to calculate bounding boxes of every Renderlet. We can do this on the CPU pretty easily for glTF files because their bounds are included in mesh primitives.
Done.
Thoughts about this devlog🔗
I think I'm going to part out the devlog from the rest of the renderling repo. I'd like to be able
to update the devlog without having to reference and push a branch of renderling. This would also
make it easier to support better editing features, like CI-powered previews and deployment.
...
Tue Sep 24, 2024🔗
Since yesterday's flamegraphs didn't give me much good info I'm going to spend this morning
adding some performance tracing to my Stage::render function. This should be able to tell
me what's taking the most time.
...
Tracing so far hasn't been a ton more help. I can see that for most models the glTF viewer runs at a smooth ~62fps, but on Sponza it runs at about ~21fps.
Here's the pivot table for one frame of the example glTF viewer when viewing "VirtualCity":
| name | SUM(dur) | Count |
|---|---|---|
| render | 38ms 499us 166ns | 4 |
| get_next_frame | 25ms 910us 833ns | 1 |
| get_next_frame-surface | 25ms 905us 292ns | 1 |
| tick_internal | 3ms 205us 958ns | 3 |
| bloom | 1ms 834us 83ns | 1 |
| render_downsamples | 1ms 14us 125ns | 1 |
| tick | 677us 333ns | 3 |
| render_upsamples | 669us 459ns | 1 |
| animate | 654us 792ns | 1 |
| render-innner | 285us 542ns | 2 |
| render_mix | 135us 375ns | 1 |
| render-inner-skybox | 2us 833ns | 1 |
| render-inner-multi-draw | 2us 542ns | 2 |
| upkeep | 1us 792ns | 1 |
| tick_loads | 1us 500ns | 1 |
| log event | 0s | 1172 |
And on "Sponza" there's different render times, but the longer of the two is this:
| name | SUM(dur) | Count |
|---|---|---|
| render | 73ms 152us 918ns | 6 |
| get_next_frame | 62ms 660us 667ns | 1 |
| get_next_frame-surface | 62ms 650us 750ns | 1 |
| bloom | 3ms 25us 791ns | 1 |
| render_downsamples | 1ms 585us 833ns | 1 |
| render_upsamples | 1ms 305us 917ns | 1 |
| tick_internal | 707us 41ns | 3 |
| render-innner | 488us 917ns | 2 |
| render_mix | 121us | 1 |
| tick | 39us 208ns | 3 |
| render-inner-multi-draw | 6us 958ns | 2 |
| render-inner-skybox | 3us 834ns | 1 |
| upkeep | 2us 417ns | 1 |
| tick_loads | 1us 833ns | 1 |
| animate | 1us | 1 |
| log event | 0s | 759 |
So you can see that "Sponza" has a 92% percent increase in frame time.
Most of that is obviously get_next_frame-surface, with an increase of 142%!
But that function just proxies to wgpu::Surface::get_current_texture(), so I'm not sure
what's up. I'm asking around in the wgpu matrix channel.
cwfitzgerald
schell I'm profiling my renderer and I've found that with certain glTF files, Surface::get_current_texture can take a really long time. It seems that in one profiling session with model "A" it takes ~25ms, whereas with model "B" it takes ~62ms. Does anyone here have any ideas on what else I can measure to figure this out? I think even 25ms is a really long time - am I wrong?
get_current_texture is blocking on the gpu
So the GPU is doing a bunch of work and Surface::get_current_texture is waiting for that work to
complete before returning the next frame from the swapchain. This tracks. It also means that using
tracing to profile is useless, as all that GPU work gets queued "behind the curtain". Also -
flamegraphs are equally useless for the same reason.
The only option is to profile using Xcode, since it has some pretty nice GPU capture capabilities.
Unfortunately for me, it is always buggy. Not only is Xcode launching two, sometimes three copies of my executable, it often fails to capture a GPU frame. Once it fails, it cannot recover even after "power cycling" Xcode. I actually have to restart my computer to get a clean capture again.
Searching the Apple Developer Forums for the solution will find you commiserating with your fellow mac-bound graphics devs. Wonderful tools. Poor support. I really wish Apple would invest in parting out their tools from Xcode. Can I have just a graphics debugger?
I'll try updating my whole OS to see if that fixes it...
Mon Sep 23, 2024🔗
Sponza🔗
I fixed the textures. It turns out that I wasn't properly handling glTF textures. I had assumed the texture index was the image source index. After fixing that the model looks much better.
I also added WASD mouse controls to the glTF viewer. There's some jitter in when looking around while strafing. I'm not sure what's up with that.
nlnet updates🔗
I have an initial candidate for frustum culling. I'm using the Sponza model as a test case, as currently I get a pretty consistent 21fps when viewing that model.

But I should probably record some flamegraphs first, just to ensure that frustum culling is what it needs...
...
Eh, the flamegraphs don't seem to be too helpful.
Sun Sep 22, 2024🔗
Sponza🔗
Previously when attempting to load the famous Sponza model renderling would barf when attempting
to load the textures. This was before Atlas was backed by a texture array. Before using a texture
array Atlas was limited to one 2048 square texture. Now you can specify how big to make that
texture array, so I'd like to ensure that renderling can render Sponza. That's what I'm going
to work on today, as it's a good test for culling, light tiling and shadow maps.
Loading bytes
First step in getting Sponza up and running is supporting non-embedded glTF models. Prior to
now I've kicked that can down the road because renderling supports web, which makes
filesystem loads difficult because on web that translates to a new request to a server.
It's not so much that renderling doesn't support filesystem models, it's just that the
example glTF viewer doesn't.
...
Oddly enough it looks like after loading from a path insteado f bytes, it works just fine:
Obviously some of the roof textures are whacky, and the camera controls aren't correct for this model. The glTF viewer is set up to use a turntable style control, whereas the Sponza model really should be WASD-mouse controlled.
I think I'll add WASM-mouse control as a command line option now.
...
Fri Sep 20, 2024🔗
I'm trying to decide what the next step is - either I can tackle frustum culling, light tiling or shadow mapping.
In the meantime I finally got around to using
RenderPass::multi_draw_indirect
for my draw calls, when available.
The only hitch was that Renderlets that have been marked invisible were still getting drawn.
This is because previously we checked is_visible on the CPU and simply didn't send that draw
call, but now that it's hosted in a buffer we check in the vertex shader itself, and if
is_visible == false we move the vertex outside of the clipping frustum. It's sub-optimal but
it's dead easy and I think it's probably a good trade-off. This feature is meant to be used to
save time on draw calls, which it will, even if we have to discard some triangles.
Thu Sep 19, 2024🔗
I'm looking for a new logo. The "meat-on-bone" emoji is not doing this project justice.
I'd like the new logo to be a cute 3d asset that I can use renderling to render, and
have it show off the features of the libary. I'll be talking to some artists to see how
much this might cost. Here's my shortlist of talented artists:
Paul Marion Wood
Paul is a Design Manager at LEGO. We grew up together and are close friends. He's a great artist and I would love to work with him. His models are amaizing for their detail, humor, whimsicality and irreverance. He'd be a shoe in as he creates cute and cool things constantly at LEGO.
Links:

Nigel Goh
I don't know much about Nigel but I found his stuff on instagram a couple years ago and have been following him since. His stuff just looks like the kind of game I'd like to play. I will be buying his art packs when I start my next game.

Wed Sep 18, 2024🔗
nlnet updates🔗
#5824 merged! This means that in the next release
of wgpu, most of the SPIR-V atomic ops will be supported!
Thank you @jimb!
I ended up cutting out support of OpAtomicFlagClear and OpAtomicFlagTestAndSet at the
last minute because I didn't have tests for them in place, and they can't be generated from
rust-gpu, which is what I use to generate my SPIR-V shaders (this is also why I didn't
have tests for them).
Also there is one other unsupported op - OpAtomicCompareExchange. That one will take a little
more infrastructure to support, as the types involved in the WGSL side are a bit more complicated.
But all in all, I think this part of the project is a success!
Mon Sep 16, 2024🔗
nlnet updates🔗
I've been constantly pinging the wgpu folks about my third wgpu PR, which adds parsing for
a bunch of atomic ops - but still no review.
I've stopped getting any response from the maintainers about two weeks ago.
So I'm going to cut my last PR on top of the third one and then run with my own fork
of wgpu to try to finish out the rest of my milestones. The last
PR will add support for OpAtomicCompareExchange, which is the trickiest op.
...
@jimblandy got to it! Looks like this will merge soon 🤞.
Wed Sep 4, 2024🔗
nlnet updates🔗
I'm just waiting for a review on my third PR, which adds parsing for a bunch of atomic ops. The turn-around time has gotten pretty long, though - this PR has been sitting for a month and I can't seem to get folks to review it. I'm sure if I keep pinging them they'll pick it back up but I don't like doing that. I know they're busy with day jobs just like I am, but my time on this grant is running out, and I still have 6 milestones to hit.
Atlas updates🔗
I'm updating the atlas so that it automatically evicts frames/textures without any
references (stale or dead frames and textures). I think I'll just merge AtlasFrame
and AtlasTexture. The only reason they're separate is in case somebody wants to have
different wrapping parameters for the same texture data, but I don't think any graphics
APIs even support this.
...
It wasn't too hard!
Mon Aug 26, 2024🔗
I'm adding morph targets. I've done this once before so I expect it'll be pretty easy.
...
Most of my time was spent reloading the concept into my brain.
But now I notice that the morph-target stress test glTF file isn't displaying properly. The morph targets/animation stuff is fine, it's the texturing on the base that is off.
I think it might be the texture's repeat/wrapping. It also looks like it has ambient occlusion, oddly enough, and it seems the AO texture is getting read.
I created a ticket to track the MorphStressTest texture bug.
Sun Aug 25, 2024🔗
Fox rigging bug🔗
Still working on the fox rigging bug. I'm going to write a test that performs the skinning on CPU and see how that goes.
...
I've added the test here.
It passes, so I don't think the problem is in the node/bone global transform calculation. Next I'll try testing the joint matrix and skinning matrix calculations.
...
Ok, I made a little progress there. I think what I'll do is checkout the last commit where skinning was good, write a test to output some of the Fox's vertices, joint matrices and skinning matrices and then use those as data in a unit test on my bugfix branch. I probably should have started here.
...
Turns out it doesn't compile at that commit, I know it did at the time, but it looks like one of the dependencies is borked. Instead of spending a bunch of time debugging that problem, I'll just port over some of the functions.
...
First I'm going to do a sanity check to ensure that NestedTransform is updating the entire hierarchy
correctly.
Yup, that's fine.
...
I found another glb model with distortion - CesiumMan.
I found another glb model with distortion - RobotExpressive. It's actually a really cute robot with some great animations in it. Good find. Even better is that I found a three.js issue that seems to detail the same problem I'm having - I hope.
...
THAT WAS THE KEY.
The solution was to normalize the weights before collecting the vertices.
This fixes the Fox model, and the cute robot model, but the cute robot model still has an odd artifact on its thumb during animation.
This does not fix CesiumMan, so I'll have to investigate that separately.
Thu Aug 22, 2024🔗
Distorted Fox, continued🔗
Looking back at what I had written previously, it seems I was indeed using global transforms of bones. This means somehow my current matrices are borked, even if the concept is the same and was previously working. Though I remember it was a bit fiddly getting it to work in the first place. Here's that unearthed code inline just to make it easier:
    /// Return the matrix needed to bring vertices into the coordinate space of
    /// the joint node.
    pub fn get_joint_matrix(
        &self,
        i: usize,
        joint_ids: &[Id<GpuEntity>; 32],
        entities: &[GpuEntity],
    ) -> Mat4 {
        if i >= self.joints.len() {
            return Mat4::IDENTITY;
        }
        let joint_index = self.joints[i];
        let joint_id = if joint_index as usize >= joint_ids.len() {
            Id::NONE
        } else {
            joint_ids[joint_index as usize]
        };
        if joint_id.is_none() {
            return Mat4::IDENTITY;
        }
        let entity_index = joint_id.index();
        if entity_index >= entities.len() {
            return Mat4::IDENTITY;
        }
        let joint_entity = &entities[entity_index];
        let (t, r, s) = joint_entity.get_world_transform(entities);
        let trs = Mat4::from_scale_rotation_translation(s, r, t);
        trs * joint_entity.inverse_bind_matrix
    }

    /// Return the result of adding all joint matrices multiplied by their
    /// weights for the given vertex.
    // See the [khronos gltf viewer reference](https://github.com/KhronosGroup/glTF-Sample-Viewer/blob/47a191931461a6f2e14de48d6da0f0eb6ec2d147/source/Renderer/shaders/animation.glsl#L47)
    pub fn get_skin_matrix(&self, joint_ids: &[Id<GpuEntity>; 32], entities: &[GpuEntity]) -> Mat4 {
        let mut mat = Mat4::ZERO;
        for i in 0..self.joints.len() {
            mat += self.weights[i] * self.get_joint_matrix(i, joint_ids, entities);
        }
        if mat == Mat4::ZERO {
            return Mat4::IDENTITY;
        }
        mat
    }
And here's the GpuEntity::get_world_transform function at the time:
    pub fn get_world_transform(&self, entities: &[GpuEntity]) -> (Vec3, Quat, Vec3) {
        let mut mat = Mat4::IDENTITY;
        let mut id = self.id;
        loop {
            let entity = entities[id.index()];
            mat = Mat4::from_scale_rotation_translation(
                entity.scale.xyz(),
                entity.rotation,
                entity.position.xyz(),
            ) * mat;
            id = entity.parent;
            if id.index() >= entities.len() {
                break;
            }
        }
        let (s, r, t) = mat.to_scale_rotation_translation();
        (t, r, s)
    }
The current NestedTransform calculates its world transform like so:
    pub fn get_global_transform(&self) -> Transform {
        let maybe_parent_guard = self.parent.read().unwrap();
        let transform = self.get();
        let parent_transform = maybe_parent_guard
            .as_ref()
            .map(|parent| parent.get_global_transform())
            .unwrap_or_default();
        Transform::from(Mat4::from(parent_transform) * Mat4::from(transform))
    }
This expands roughly to great_grand_parent_transform * grand_parent_transform * parent_transform * child_transform.
Converting from Mat4 to Transform makes me a little nervous, but it's rather simple:
impl From<Transform> for Mat4 {
    fn from(
        Transform {
            translation,
            rotation,
            scale,
        }: Transform,
    ) -> Self {
        Mat4::from_scale_rotation_translation(scale, rotation, translation)
    }
}
Sat Aug 17, 2024🔗
naga SPIR-V updates🔗
My third PR into wgpu is up and I'm just waiting for
a review...
Distorted Fox🔗
I'd like to squash this rigging issue once and for all. It's always tricky.
Skin/Rigging bug - pipeline drilldown
First let's go over how GLTF nodes are loaded into renderling in the
GltfDocument::from_gltf function:
For each node we create a NestedTransform, which is a CPU struct that has a global
transform ID, a shared local transform (TRS) and a shared list of parent
NestedTransforms:
#[derive(Clone)]
pub struct NestedTransform {
    global_transform_id: Id<Transform>,
    local_transform: Arc<RwLock<Transform>>,

    notifier_index: usize,
    notify: async_channel::Sender<usize>,

    children: Arc<RwLock<Vec<NestedTransform>>>,
    parent: Arc<RwLock<Option<NestedTransform>>>,
}
We keep all the transforms in a temporary cache, which we use to look up when creating the GLTF document nodes:
fn transform_for_node(
    nesting_level: usize,
    stage: &mut Stage,
    cache: &mut HashMap<usize, NestedTransform>,
    node: &gltf::Node,
) -> NestedTransform {
    let padding = std::iter::repeat(" ")
        .take(nesting_level * 2)
        .collect::<Vec<_>>()
        .join("");
    let nt = if let Some(nt) = cache.get(&node.index()) {
        nt.clone()
    } else {
        let transform = stage.new_nested_transform();
        let (translation, rotation, scale) = &node.transform().decomposed();
        let t = Transform {
            translation: Vec3::from_array(*translation),
            rotation: Quat::from_array(*rotation),
            scale: Vec3::from_array(*scale),
        };
        transform.set(t);
        for node in node.children() {
            let child_transform =
                transform_for_node(nesting_level + 1, stage, cache, &node);
            transform.add_child(&child_transform);
        }
        cache.insert(node.index(), transform.clone());
        transform
    };
    let t = nt.get();
    log::trace!(
        "{padding}{} {:?} {:?} {:?} {:?}",
        node.index(),
        node.name(),
        t.translation,
        t.rotation,
        t.scale
    );
    nt
}
This ensures that each node is only created at most once, and that all its children are also created.
We create all the nodes as GltfNode and keep them in a vector. GltfNode contains the
NestedTrantsform and indexes into other vectors in the document.
NestedTransform is a special type in that whenever it is modified it gets marked
"dirty" along with all its children. This sends notice to the stage's GPU buffer.
Each frame tick on the CPU these buffer values are collected and updated on the GPU.
This happens in renderling::stage::cpu::SlabAllocator::drain_updated_sources. In
this function all update sources are polled for their new values and then updated in
the GPU buffer. NestedTransform gives its global transform as its new value.
This is how NestedTransform calculates its global transform:
    pub fn get_global_transform(&self) -> Transform {
        let maybe_parent_guard = self.parent.read().unwrap();
        let transform = self.get();
        let parent_transform = maybe_parent_guard
            .as_ref()
            .map(|parent| parent.get_global_transform())
            .unwrap_or_default();
        Transform::from(Mat4::from(parent_transform) * Mat4::from(transform))
    }
Later we load the meshes and each mesh's primitives. Loading each primitives loads its joints and weights. The only transformation that happens here is that the weights are normalized if they aren't already normalized within the GLTF file.
Later we load the skins with GltfSkin::from_gltf. This runs through all the joints
of the skin, collecting the global transform id (Id) of each joint's NestedTransform
and storing it in an array on the GPU as the skin's joint_transforms. This also stores
the inverse_bind_matrices of the skin on the GPU. No transformation is applied to the
inverse bind matrices.
So then what's happening on the GPU is in renderling::stage::renderlet_vertex. We read
the renderlet, from that we read if the renderlet has a skin. If the renderlet has a skin
we read the skin and then get the skinning matrix for the vertex with
skin.get_skinning_matrix:
pub fn get_skinning_matrix(&self, vertex: Vertex, slab: &[u32]) -> Mat4 {
    let mut skinning_matrix = Mat4::ZERO;
    for i in 0..vertex.joints.len() {
        let joint_matrix = self.get_joint_matrix(i, vertex, slab);
        // Ensure weights are applied correctly to the joint matrix
        let weight = vertex.weights[i];
        if weight > 0.0 {
            skinning_matrix += weight * joint_matrix;
        }
    }

    skinning_matrix
}
The bulk of that work is in Skin::get_joint_matrix:
pub fn get_joint_matrix(&self, i: usize, vertex: Vertex, slab: &[u32]) -> Mat4 {
    let joint_index = vertex.joints[i] as usize;
    let joint_id = slab.read(self.joints.at(joint_index));
    let joint_transform = slab.read(joint_id);
    // Use the corrected method to get the inverse bind matrix
    let inverse_bind_matrix = self.get_inverse_bind_matrix(i, slab);
    Mat4::from(joint_transform) * inverse_bind_matrix
}
Above we read out the joint_id, which is the Id of the joint node's
NestedTransform. Which means joint_transform is the global transform of the joint.
That is - it's the transform that brings the joint's node into world-space. We then
multiply this transform by the joint's inverse bind matrix. I think this might be where
the algorithm is going wrong?
A small change
If we change the code above to inverse_bind_matrix * Mat4::from(joint_transform) we
get a fox that is MUCH LESS distorted, but the further the animation takes the vertices
from the resting position, the more distorted it gets (it results in a fox animation that
looks weird at the edges of its transition). So there's still some funkiness, but the
majority of the problem is gone.
This change also makes the SimpleSkin.gltf example fail. It warps the skin too far.
So at least it's consistent.
Last thoughts
My last thought for the day is that maybe there's a transformation that's getting applied
multiple times. When pushing the mesh to the GPU we have to create a Renderlet for each
mesh primitive, because each primitive must be a separate draw. So what I think may be
happening is that the skinning matrix is being calculated and in that calculation the
joint node matrices already include the node's transform - but the vertex shader also
multiplies the skinning matrix by the renderlet transform...
...though it turns out getting rid of that multiplication does nothing.
Ok not quite
After creating an Animator and animating 0.0 seconds - we get the deformation. If
we don't animate, there is no deformation.
Wed Aug 7, 2024🔗
I got another sponsorship on Github! Second Half Games, (maker of Meanwhile in Sector 80, sponsored me in a significant way. Thank y'all! The game they're making looks really cool, to boot.
naga SPIR-V updates🔗
I'm preparing the next PR into wgpu that would bring in support for almost all the rest of the
atomic operations. After that there should be one more to support AtomicCompareExchange, which is
the last op to be supported. The reason AtomicCompareExchange is last is because the return type
more complicated - it's a struct containing the previous value and a bool of whether or not it was
exchanged. This is going to take extra work in the atomic_upgrade module, unlike the other ops,
which only require parsing.
Sat Jul 6, 2024🔗
nlnet updates🔗
Milestone 1 is complete! wgpu users should now be able to write shaders that use the
AtomicIIncrement operator in SPIR-V!
Here is the tracking ticket for atomics support.
This was a big milestone for me as it's my first significant contribution to a large open source project, and it was quite technically challenging. It feels good!
Mon June 17, 2024🔗
nlnet updates🔗
The first nlnet milestone PR is really close to merging. I'm already working on the follow up PR that adds the rest of the operators, which is milestone #2.
Sun June 16, 2024🔗
nlnet updates🔗
After some back and for with @jimblandy on my second PR I've landed on a set of changes that
actually produce a validating naga::Module! That means the system is producing viable code!
What this means is that I'm actually very close to hitting the first nlnet milestone!
With that, I've started work on the second milestone while my first set of PRs are in review, as it takes a good while to roundtrip w/ feedback.
Spiralling out
Previously we had talked about upgrading expressions, and how there would be a "spiralling out"
or "cascade" of upgrades needed. I think we've mostly side-stepped that requirement by first
realizing that atomics can really only be held in global variables since they only appear in
workgroup and storage address spaces.
So these ops will always be accessed through a pointer to a global variable, and we can modify that global variable's type in place and then not worry about having to upgrade the expressions that contain that global variable. It's a nice simplification.
The reason I think you won't need to update any expressions is that Naga IR Load expressions and Store statements both can operate on Atomics, so everything accessing the globals whose types you're whacking, whether Loads, Stores, or Atomics, should still be okay.
-- Jim Blandy
raspberry pi updates🔗
Still getting OOM errors and I'm not sure why. There are a few changes I need to make to figure it out:
env var configurable logging in tests
because we need to be able to debug where the memory is going
add a new test that ensures the image comparison machinery is sane
because the comparisons seem pretty borked
as an example, here's an image comparison:
expected:
seen:
mask:
diff:
seen.pngis nothing but wacky garbage!
Fri June 14, 2024🔗
nlnet updates🔗
I put up another incremental PR for naga's SPIR-V frontend
that applies atomic upgrades to types and to a lesser extent to expressions. It's currently awaiting
review from @jimblandy. If I'm still on-point and understanding the direction then I'll be adding the
"spiraling out" of expression upgrades next.
The "spiraling out" problem is roughly that expressions contain sub-expressions and
any expression that requires an upgrade might be referenced as a sub-expression of another,
therefore after an expression upgrade we need to traverse the Module looking for these
references and upgrade the expressions that contains them - which then must be iterated upon
again, searching the Module for expressions that may contain those as sub-expressions.
Sun June 9, 2024🔗
nlnet updates🔗
Following @jimblandy's advice I've got a good portion of the atomic "upgrade" process working.
Tue June 4, 2024🔗
nlnet updates🔗
I'm working on "upgrading" pointer types in naga's SPIR-V frontend. This really is the meat of the
problem, I would say. I'm attempting to follow this process, roughly:
in the frontend:
lookup the pointer's expression
lookup the type of that expression
get the id of the base type of that type (because the type is essentially
Pointerand we want theT)lookup up the base type
then in the
Module:get that same base type in the types arena
replace that type with an atomic type
This works fine, so long as no other types are using that base type. Odds are that the base type is
u32 or i32, though, and that it is indeed being used elsewhere, which fails to type check.
This is expected because we're changing the type for everything that references it.
So, instead we can try it this way - it's all the same up to interacting with the module:
then in the
Module:create a new atomic type with the base type of the type we were going to replace
get the pointer type from the types arena
replace the pointer's base type with the atomic type
This gives us a different error:
WithSpan { inner: InvalidHandle(ForwardDependency(FwdDepError { subject: [3], subject_kind: "naga::Type", depends_on: [6], depends_on_kind: "naga::Type" })), spans: [] }which essentially means that type [3] depends on type [6] but obviously 3 < 6, and this is a
problem because the handles of the types imply when they were declared. So it's saying that [3]
cannot depend on [6] because when declaring [3] all symbols used in that declaration must also
have been previously declared, and [6] is greater than [3] and therefore was not pre-declared.
So here we are. I've had a couple ideas, and none of them are great:
Modify all handles in the module and the frontend, incrementing all handles >= the pointer's handle, then inserting the atomic type using the pointers handle. This is error prone because I'm not sure where all the handles are, where they get copied, etc. But maybe I'm overestimating this solution.
Change
Handle's type to include some extra bit of information to allow the comparison to check. This is bad for obvious reasons -Handleis small on purpose and something like this would probably blow out the performance characteristics. Also there are probably many handles being created and there may be memory concerns.Do something else like provision some handles up front to use later. Possibly any time a pointer is created, also create another placeholder handle.
I posted this on the wgpu/naga matrix and @jimblandy replied here.
Mon June 3, 2024🔗
nlnet updates🔗
My first PR to add atomics to naga's SPIR-V frontend was merged last week! I'm super stoked because I was worried it might be a bit beyond my pay grade, but I figured it out with the help of @jimblandy.
Atlas improvements🔗
Finally, the atlas in renderling is a true texture array, greatly increasing renderling's texture
capacity.
By default the atlas holds an array of 2048x2048x8 textures, but it's configurable so if you need
more you can bump up the default size in Context, before you create the stage.
renderling-ui🔗
I've rebuilt and released a good portion of renderling-ui.
Partially because @jimsynz wanted to use renderling as a scenic driver,
and partially because I still want to be able to write game and tools UI with renderling.
Sat May 25, 2024🔗
SPIR-V atomics update🔗
My first PR to add atomics to naga's SPIR-V frontend is
just about ready. Most of the work has been about figuring out how to use the naga machinery.
Here's a step-by-step of the strategy for adding support for parsing a new atomic operation:
Add a match for the op in the
terminatorloop ofnaga::front::spv::Frontend::next_block. Like so. This matches whenever the parser encounters your op.Ensure the current instruction is the correct size. Here. Essentially,
inst.expect({size})?;, wheresizecan be found from the SPIR-V spec, which in this case is https://registry.khronos.org/SPIR-V/specs/unified1/SPIRV.html#OpAtomicIIncrement.The first value in the table is the "Word Count" of the instruction. From the spec:
Word Count is the high-order 16 bits of word 0 of the instruction, holding its total WordCount. If the instruction takes a variable number of operands, Word Count also says "+ variable", after stating the minimum size of the instruction.
You can find the lowdown on the form of each instruction here.
Then we store the op for a later pass (to be implemented later) when we'll upgrade the associated types: Here.
Lastly we have the real meat of the problem where we construct the types and variables in the
nagamodule. Shown here. This step will be different for each op and depends on the inputs and outpus of that op.
At this point the op can be parsed and WGSL (or whatever the output language) can be emitted, but the module will fail to validate. This is expected because the types used in the atomic op have not yet been upgraded to their atomic counterparts, which is the crux of the problem and also the subject of the next PR.
Tue May 21, 2024🔗
Crabslab updates🔗
I replaced the slab indexing in crabslab with spirv_std::IndexUnchecked when the target_arch
is "spirv". This had the effect of DRASTICALLY reducing the nesting in the resulting WGSL code,
and also GREATLY reducing the size of that code. Here are some percentage changes in the SPIR-V
shader files produced by rust-gpu:
- 7.55%: bloom-bloom_downsample_fragment.spv
-10.00%: bloom-bloom_mix_fragment.spv
-10.81%: bloom-bloom_upsample_fragment.spv
  0.00%: bloom-bloom_vertex.spv
  0.00%: convolution-brdf_lut_convolution_fragment.spv
  0.00%: convolution-brdf_lut_convolution_vertex.spv
  0.00%: convolution-generate_mipmap_fragment.spv
  0.00%: convolution-generate_mipmap_vertex.spv
  0.00%: convolution-prefilter_environment_cubemap_fragment.spv
-36.00%: convolution-prefilter_environment_cubemap_vertex.spv
  0.00%: skybox-skybox_cubemap_fragment.spv
-33.08%: skybox-skybox_cubemap_vertex.spv
  0.00%: skybox-skybox_equirectangular_fragment.spv
-40.00%: skybox-skybox_vertex.spv
-25.27%: stage-renderlet_fragment.spv
-30.77%: stage-renderlet_vertex.spv
- 6.78%: tonemapping-tonemapping_fragment.spv
  0.00%: tonemapping-tonemapping_vertex.spv
  0.00%: tutorial-tutorial_implicit_isosceles_vertex.spv
  0.00%: tutorial-tutorial_passthru_fragment.spv
-39.29%: tutorial-tutorial_slabbed_renderlet.spv
-37.76%: tutorial-tutorial_slabbed_vertices.spv
-37.50%: tutorial-tutorial_slabbed_vertices_no_instance.spv
Drastically reducing the nesting in resulting WGSL code means that naga shouldn't err when
translating the SPIR-V code into WGSL on web. This means that renderling works on web again!
Greatly reducing the size of the SPIR-V files may eliminate the stack overflow on Windows.
Tue May 14, 2024🔗
Website!🔗
Part of the NLnet work is setting up a website to host this devlog, docs, guides etc.
So yesterday I bought a domain - renderling.xyz!
I figured since renderling is a 3d renderer .xyz was a good choice. It was either that
or .rs, but I do my domains through AWS Route53 which doesn't support .rs as a TLD.
Also I hope that this library gets used by a wider audience than just the Rust community.
I have plans to write bindings at some point, afterall.
naga SPIR-V atomics support🔗
I opened my first PR into wgpu to add support for atomics in the SPIR-V frontend.
This is the first of many PRs and this is the main focus of the NLnet work.
The PR itself is more of a sanity check that I'm "doing things right". I figured I'd
open it early since I'm unfamiliar with the way naga does things.
Sun May 12, 2024🔗
More Fox Skinning🔗
I've noticed that some GLTF models (like CesiumMan) cause the uber-shader to barf.
I haven't figured out what feature in those models is causing it yet. It may or may not
be related to the fox skinning problem.
Box!🔗
A very simple GLTF file fails to render. It's the Box.glb model.

Ooh, now upon visiting the Khronos sample models repo I find that it (the repo) has been deprecated in favor of another.
Anyway - this is a fundamentally simple GLTF model so something must have regressed in renderling...
Investigation
Turns out there are buffer writes happening each frame, which is weird because the
Box.glbmodel doesn't include animation.When I trace it out it looks like the camera's view has NaN values.
Looks like after adding a
debug_assert!I can see that the camera's calculated radius (the distance at which the camera rotates around the model) isinf...That's because after loading, the model's bounding box is
[inf, inf, inf] [-inf, -inf, -inf]...And calculation of the bounding box only takes into consideration the nodes in the scene and doesn't include those node's children...
After updating the bounding box calculation to take child nodes into consideration the problem is fixed.
But there are still two
Transformwrites per frame when there should be none.I can't see any other place in the example app where those transforms are being updated.
I recently redid the way
NestedTransformdo their updates, so I'll look there.There's nothing modifying those transforms...
Ah, but each update source is being polled for updates each frame, and NestedTransforms always give their global transform as an update regardless if it changed.
I'm changing the update sources to be a set, and the
SlabAllocatoronly checks those sources that have sent in an "update" signal on its notification channel. This also means we only check sources for strong counts when this "update" signal comes in, so those sources need to send the signal on Drop. All in all though this should be a nice optimization....but alas, after the update I get the grey screen of death again, which means something's not right...
Turns out it was because
Gpu::newwas callingSlabAllocator::next_update_ktwice, using one for itsnotifier_indexand then using the other for the first notification.
Sat May 11, 2024🔗
Skinning a Fox🔗
Skinning is pretty hard! I remember before that it took a good amount of fiddling before vertex skinning "clicked". I understand the concept and how it should work, but in practice I feel like there's always a matrix multiplication that is in the wrong order, or that I'm missing (I've been through it twice now).
It's weird because the "simple skin" example runs as expected. For the most part the "recursive skins" example does too (it's slow though because it's a stress test). So there's something special about the fox that is tripping the renderer...
cargo watch -x 'run -p example -- --model /Users/schell/code/glTF-Sample-Models/2.0/RecursiveSkeletons/glTF-Binary/RecursiveSkeletons.glb --skybox /Users/schell/code/renderling/img/hdr/resting_place.hdr'
Sidetracked by performance🔗
I saw that the recursive skeleton example wasn't doing so well, it was really slow. After a little investigation I saw that it was making something like 40,000 separate buffer writes per frame.
So I rewrote the "updates" code that syncs CPU -> GPU values and now it does 900 buffer writes per frame. That still seems high, but given that it has something like 800 animated nodes I don't think it's a big deal. It runs smooth now!
But I still haven't figured out that fox...
Wed May 9, 2024🔗
I finished the Memorandum of Understanding for my NLnet grant. The MoU is kinda like a project plan or roadmap that lets NLnet know what the milestones are and when I'll be requesting payment. It's nice to have this amount of organization - even if there is a bit of overhead for it. I like knowing the steps the library is going to move through.
Animation🔗
I'm having trouble debugging the fox's animation.
It could be:
hierarchical node transforms are not recalculating as expected
node hierarchy could be wrong in some way
Let's step through one animation frame:
progressing 'Survey' 0.001417125 seconds
  total: 3.4166667
  current: 0.21563251
  21 properties
    8 rotation
    7 rotation
    11 rotation
    10 rotation
    9 rotation
    14 rotation
    13 rotation
    12 rotation
    6 rotation
    5 rotation
    17 rotation
    16 rotation
    15 rotation
    20 rotation
    19 rotation
    18 rotation
    24 rotation
    23 rotation
    22 rotation
    4 translation
    4 rotation
And here's the log output while building the GLTF model:
drawing GLTF node 0 Some("root")
  node has no mesh
  has 1 children: [2]
drawing GLTF node 2 Some("_rootJoint")
  node has no mesh
  has 1 children: [3]
drawing GLTF node 3 Some("b_Root_00")
  node has no mesh
  has 1 children: [4]
drawing GLTF node 4 Some("b_Hip_01")
  node has no mesh
  has 4 children: [5, 15, 18, 22]
drawing GLTF node 5 Some("b_Spine01_02")
  node has no mesh
  has 1 children: [6]
drawing GLTF node 6 Some("b_Spine02_03")
  node has no mesh
  has 3 children: [7, 9, 12]
drawing GLTF node 7 Some("b_Neck_04")
  node has no mesh
  has 1 children: [8]
drawing GLTF node 8 Some("b_Head_05")
  node has no mesh
  has 0 children: []
drawing GLTF node 9 Some("b_RightUpperArm_06")
  node has no mesh
  has 1 children: [10]
drawing GLTF node 10 Some("b_RightForeArm_07")
  node has no mesh
  has 1 children: [11]
drawing GLTF node 11 Some("b_RightHand_08")
  node has no mesh
  has 0 children: []
drawing GLTF node 12 Some("b_LeftUpperArm_09")
  node has no mesh
  has 1 children: [13]
drawing GLTF node 13 Some("b_LeftForeArm_010")
  node has no mesh
  has 1 children: [14]
drawing GLTF node 14 Some("b_LeftHand_011")
  node has no mesh
  has 0 children: []
drawing GLTF node 15 Some("b_Tail01_012")
  node has no mesh
  has 1 children: [16]
drawing GLTF node 16 Some("b_Tail02_013")
  node has no mesh
  has 1 children: [17]
drawing GLTF node 17 Some("b_Tail03_014")
  node has no mesh
  has 0 children: []
drawing GLTF node 18 Some("b_LeftLeg01_015")
  node has no mesh
  has 1 children: [19]
drawing GLTF node 19 Some("b_LeftLeg02_016")
  node has no mesh
  has 1 children: [20]
drawing GLTF node 20 Some("b_LeftFoot01_017")
  node has no mesh
  has 1 children: [21]
drawing GLTF node 21 Some("b_LeftFoot02_018")
  node has no mesh
  has 0 children: []
drawing GLTF node 22 Some("b_RightLeg01_019")
  node has no mesh
  has 1 children: [23]
drawing GLTF node 23 Some("b_RightLeg02_020")
  node has no mesh
  has 1 children: [24]
drawing GLTF node 24 Some("b_RightFoot01_021")
  node has no mesh
  has 1 children: [25]
drawing GLTF node 25 Some("b_RightFoot02_022")
  node has no mesh
  has 0 children: []
drawing GLTF node 1 Some("fox")
  mesh 0
    has 1 primitives
    created renderlet 1/1: Renderlet {
        visible: true,
        vertices_array: Array(370, 1728),
        indices_array: Array(null),
        camera_id: Id(24),
        transform_id: Id(309),
        material_id: Id(348),
        pbr_config_id: Id(0),
        debug_index: 0,
    }
  has 0 children: []
NAN in shaders for no apparent reason🔗
While re-building vertex skinning I've run into an odd problem where naga says my SPIR-V has
NaN values in it, which are invalid. I'm trying to track down where these values are getting
introduced. It's somewhere in glam, I'm pretty sure.
To aid in doing this I'm taking advantage of the validate_shaders test and cargo watch.
My setup is like this:
in my code I've created a minimal vertex shader to work on in isolation:
#[spirv(vertex)]
pub fn nan_catcher(
    #[spirv(vertex_index)] vertex_index: u32,
    #[spirv(storage_buffer, descriptor_set = 0, binding = 0)] slab: &[u32],
    #[spirv(position)] clip_pos: &mut Vec4,
) {
    let skin = Skin::default();
    let t = skin.get_transform(Vertex::default(), slab);
    *clip_pos = Mat4::from(t) * UNIT_QUAD_CCW[vertex_index as usize % 6].extend(1.0);
}
In one terminal tab we auto-compile our shaders:
  cd shaders
  cargo watch --ignore ../crates/renderling/src/linkage/ --watch ../crates/renderling/src/stage --watch ../crates/renderling/src/stage.rs -x 'run --release -- --no-default-features'
--no-default-featuresturns off all the other shaders, so only this "nan-catcher" is compiled.--ignore ../crates/renderling/src/linkage/is important because another terminal tab is creating a WGSL file in that directoryin another terminal tab we watch for changes to the compiled shaders and then run validation:
only_shader=stage-nan_catcher print_wgsl=1 cargo watch --ignore stage-nan_catcher.wgsl --watch crates/renderling/src/linkage/ -x 'test -p renderling -- --nocapture validate_shaders'
only_shadervalidates only my "nan-catcher" shader andprint_wgslsaves the source (regardless of validation)
All together this lets me know if my shader validates after each change.
Solution
As it turns out Transform's From was the culprit. It was using Mat4::to_scale_rotation_translation,
which calls f32::signum, which uses NAN.
The crappy part is that clippy would have caught it, because both of those functions are listed in disallowed-methods,
but I hardly ever run clippy. So now I've got to make that a normal practice.
Wed May 8, 2024🔗
TODO: crabslab probably doesn't need to generate the offset_of_* functions. It's a bit noisy,
and not as useful as I planned.
Also, the WgpuBuffer in crabslab probably shouldn't be part of the library. I've already
stopped using it in renderling.
Animator🔗
I've added renderling::stage::Animator to help with animating GLTF nodes.
Tue May 7, 2024🔗
I had the intake meeting with NLnet's Lwenn and Gerben and they were very sweet people. Everything went well and I should be able to get to work on naga's atomics this week!
The following is some of the stuff I managed to fit into renderling these past two weeks.
Physically based bloom!🔗
I re-built the bloom effect to the updated "PBR" technique that downsamples an HDR texture
and then upsamples the mips and mixes it in. It looks quite nice. The Bloom object can
also be used without the rest of renderling, though it depends on renderling's texture type.
I feel like the library is small enough in total that if somebody wants just the bloom it
would be worth it.
Refactor🔗
I did quite a lot of API refactoring to make the library more predictable.
Slab allocator🔗
I also added a proper slab-ish arena-ish allocator that does automatic-ish syncronozation.
With the new SlabAllocator (and Stage, for that matter) one can create "hybrid" values
that live on both the CPU and GPU. Those values can be "downgraded" to GPU-only values to
release CPU memory. Symmetrically those GPU-only values can also be "upgraded" to "hybrid"
values later.
All in all I feel like the API is really feeling quite polished!
New work in the short-term🔗
Animation🔗
I'm going to re-build GLTF animation before getting to work on atomics, since that feature is not blocked by atomics.
Atomics🔗
I'm kicking off work on adding atomics to naga's SPIR-V frontend. These are all the
operations in the SPIR-V spec (at least at my first glance):
OpAtomicLoad
OpAtomicStore
OpAtomicExchange
OpAtomicCompareExchange
OpAtomicCompareExchangeWeak
OpAtomicIIncrement
OpAtomicIDecrement
OpAtomicIAdd
OpAtomicISub
OpAtomicSMin
OpAtomicUMin
OpAtomicSMax
OpAtomicUMax
OpAtomicAnd
OpAtomicOr
OpAtomicXor
OpAtomicFlagTestAndSet
OpAtomicFlagClear
...and then it looks like there are some extension ops:
OpAtomicFMinEXT
OpAtomicFMaxEXT
OpAtomicFAddEXT
But the extensions seem to be reserved and don't have descriptions, so maybe they're not used yet?
Thu Apr 25, 2024🔗
I missed the intro meeting for NLnet grantees :(. I realized that I'm just no good at timezones. I'm so used to talking with folks in LA and SF (and I'm in NZ) that I just assumed our meeting would cross the international date line, and I got the date wrong! The NLnet folks assured me that it's ok, but I was really looking forward to meeting the other project developers.
Anyway - I've been putting together the development plan and the software bill of materials
as part of the intake process for the NLnet grant. It's a lot of crossing Ts and dotting ...
lower case Js, but the project will be so much better organized for it.
Wed Apr 24, 2024 🎉🔗
NLnet is officially sponsoring the development of renderling!
In fact, the project was specifically mentioned in their announcement, which feels good.
Here is the renderling project overview on NLnet.
Now I've got to get on my project organization and write up some documents, etc, then I
can get started adding atomics to naga, and unblock renderling's occlusion culling
and light tiling steps (they will be rust-gpu compiled compute shaders, but they require
support for atomics, which wgpu currently lacks).
Tue Apr 9, 2024🔗
Better debugging🔗
Debugging on the CPU is great - it finds a lot of bugs relatively quickly. It's no silver bullet though, because often the size of types are different on the GPU, and the implementations of functions are different as well.
To some bugs, debugging on the GPU is necessary - but without special features and some
Vulkan layer magic (that are unavailable to wgpu at the time of this writing),
debugging is pretty hard.
So I'm experimenting with writing my shaders to take an extra debug: &mut [u32] buffer
that it can use to write messages into. So far it works great in my vertex shader, but
the same setup (with a separate buffer) doesn't work on my fragment shader. I still don't
know why. So now I'm debugging my debugging.
For help I've posted on:
...
It seems that in fact, the values are being written, but when I read them out - I only get a few...
Wait.
Oh wait.
smh
The vertex shader only covers certain fragments.
The fragment shader would only evaluate those pixels covered by the vertex shader.
🤦
So everything is as it should be.
...Hooray! Sheesh.
Ok, debugging messages work.
Now - if I had atomics I could make this pretty ergonomic.
Sat Apr 6, 2024🔗
Finishing the debugging session🔗
It WAS crabslab! Specifically it was Slab::contains, which is used to check that
a type with an Id can be read.
Previously the definition was:
fn contains<T: SlabItem>(&self, id: Id<T>) -> bool {
    id.index() + T::SLAB_SIZE <= self.len()
}
Which seems correct, and it functions correctly on the CPU.
But on the GPU (meaning target_arch = "spirv"``) usizeis a 32bitu32,
and so the id.index() + T::SLAB_SIZEwill overflow if the id isId::NONE,
because Id::NONE = u32::MAX;`.
Indeed, the id is often Id::NONE, as that is the default!
This was causing a silent panic in my shader, which then produced no output.
Now the definition is this:
fn contains<T: SlabItem>(&self, id: Id<T>) -> bool {
    self.len() >= T::SLAB_SIZE && id.index() <= self.len() - T::SLAB_SIZE
}
What a hard-to-diagnose bug! I really need trace statements on GPU.
Fri Apr 5, 2024🔗
I have bugs after removing the SDF raymarching stuff.
Primarily I can't get any of my stage_vertex+stage_fragment tests passing.
Everything is blank.
Debug with me!🔗
it's not crabslab: I fixed some bugs in it and after testing through the
tutorialshaders I'm 80% certain it's not a (de)serialization problem.NOTHING is being written to the depth texture...
depth is cleared to 1.0
pipeline depth function is set to ALWAYS (always succeed) and still nothing is written
face culling is off and still nothing is written
running the vertex shader on CPU and printing out clip positions shows:
clips: [
    Vec4(
        -1.0,
        1.0,
        0.25,
        1.0,
    ),
    Vec4(
        -1.0,
        -1.0,
        0.25,
        1.0,
    ),
    Vec4(
        1.0,
        1.0,
        0.25,
        1.0,
    ),
]
Which is a CCW triangle up in the top left of the clip space. So we should see SOMETHING in the depth texture at least, but we don't. Why do we not? Is the render even happening on the GPU? Let's check logging to see if we're issuing the calls..
stage_renderprintsdrawing vertices 0..3 and instances 147..148so I'm certain we're actually rendering.
At this point I'm a bit at a loss. The difference between the tutorial shaders (which are working) and my stage shader is mainly that the stage shader first writes to an HDR surface and then runs tonemapping and writes the result to the frame surface. I can't see any other course of action than removing HDR and tonemapping to see if that works.
I'm going to try rendering the gltf_cmy_tri slab with the tutorial shaders.
We'll see what happens.
NOTHING! No rendering. No depth values. So this must have something to do with the data.
What to do about the wacky GLTF stage shaders🔗
I'm going to go back to a much simpler "renderlet" pbr shader program. The entire GLTF document can still live on the GPU, but GLTF is too complicated a structure to use for the internal representation.
Mon Feb 26, 2024🔗
SDF stack lang on GPU considered harmful🔗
I think anyone with a good working knowledge of GPUs could have predicted that evaluating a stack language on a GPU would turn out poorly.
Of course I don't quite fit into that aformentioned group, yet, and so I had to find this out for myself.
I think the problem is roughly that:
The SDF raymarching shader performs raymarching until an SDF is hit
includes evaluating the stack of each SDF in the scene and taking the min (obviously could use some kind of BVH)
stack evaluation is a loop with branching
Because of this, there's no real coherence between operations in a warp
So I think what I'll try next is completely ditching the stack lang and representing my SDFs analytically on the CPU, and then "serializing" them to the GPU as pre-baked distance volumes.
There's at least a little prior art.
Or maybe I'll just park SDFs for now and get back to rasterization...
SDFs going forward+🔗
I still think there's a way to make SDFs work well in this project. Consider this rasterization factory:
break down triangle geometry into meshlets
determine draw calls for meshlets
draw calls run vertex shader for meshlets
fragment shader writes to gbuffer, which might include
u32 id of object
vec3 position
vec3 normal
vec4 albedo
f32 metallic
f32 roughness
vec3 emissive
vec3 irradiance
vec3 prefiltered
vec2 brdf
f32 depth
break down SDFs into volumes
determine draw calls for SDF volumes
draw calls run vertex shader for volumes
SDF volume fragment shader writes to gbuffer
do a raymarching pass over the gbuffer, discarding fragments not drawn to, using the depth as the first already-known hit point
march till bounce...
accumulate
goto 1. or die
But I guess step 9 can be omitted until a later date. Support for rasterizing SDFs is the main point.
I like the idea of raymarching for shading, though. It seems cognitively simpler than the current pile of tricks...
Wgsly🔗
After hitting those exponential compile times with rust-gpu
(and also thinking ahead to naga's lack of atomics support), I made a quick foray into embedding
WGSL into Rust using procedural macros.
There's no quick and easy way to mate naga's IR with syn's AST parsing, so I stopped once I
realized I would have to implement syn::parse::Parse for the entirety of WGSL by hand.
It's not an insane amount of work though, and it would give nice editor tooling for any IDE that has it for Rust. Plus you could use macros to implement imports for WGSL....
Anyway - I'm going to pull it out because it's not really on topic.
Crabslab update🔗
I bumped crabslab after updating that library to use an associated constant for the slab size.
The file sizes are a tad bit smaller now, but only by at most 100 bytes.
Fri Feb 23, 2024🔗
Wavefront path tracing🔗
@eddyb recommended I read Megakernels Considered Harmful: Wavefront Path Tracing on GPUs. It's a cool paper about breaking up monolithic ray tracing shaders into microkernal steps.
There are also some breakdown posts about it:
Thu Feb 22, 2024🔗
NLNet progress🔗
Michiel Leenaars reached out from NLNet on the 17th about my proposal. It's been selected to enter the second round of the December 2023 call. 🤞
Exponentials🔗
@eddyb has been drilling down into the exponential compile-time and file sizes caused by certain type-nesting scenarios in rust-gpu.
It seems like he's found the cause(s) and has a couple ideas on how to fix it.
Get up to speed on the discord thread here.
Feature gate the shaders🔗
I'm feature gating all the shaders, that way I can build only specific shaders by using --no-default-features + --features {the_shader}.
Wed Feb 7, 2024🔗
Filesize and compile time woes🔗
Lots of discussions about file sizes on the rust-gpu discord starting here.
Long story short (go read that thread if you want the long story), inlining happens in a big way in the rust-gpu compiler, and my code got hit hard.
I was able to reduce the .spv filesize of one of my shaders over 50% (from 731kb to 304kb) and the compile time by 85% (266s to 40s) simply by converting six calls of one function into a for loop 6 times over one function call.
I'm also going to audit the crabslab API to attempt to reduce filesizes.
SlabItem read_slab audit🔗
I have a minimal crabslab based shader that reads some structs off a the slab.
It clocks in at 9756 bytes.
I also have a baseline shader that does the same by hand, without the SlabItem trait.
It weighs in at 4352 bytes.
So - just including crabslab here increases the .spv filesize by 124%!
Rundown
including
IdandArraydoesn't change the filesizeincluding
SlabItemincreases it to 4688 bytes, a 7% increase.using
fn read_slab(&mut self, id: u32, slab: &[u32]) -> u32is how we get to 4688 bytesusing
fn read_slab(id: u32, slab: &[u32]) -> (u32, Self);increases it to 4884 bytesusing
fn read_slab(id: u32, slab: &[u32]) -> Self;reduces it to 4628 bytes
After rewriting the read_slab fn to fn read_slab(id: u32, slab: &[u32]) -> Self; the minimal
crabslab based shader is only 4576 bytes, which is only 5% larger than the baseline and 53%
smaller than the previous. We'll see how much smaller my shaders get as a result.
Filesize / compilation time audit result🔗
After changing the slab reading API, bumping crabslab in renderling and recompiling my shader
the filesize was further reduced another 40% - from 304kb to 182kb.
Compilation time reduced a further 35% - from 40s to 26s!
So the total reduction in filesize is 75% - from 731kb to 182kb. Total reduction in compilation time is 90% - from 266s to 26s!
What a difference a little tangential work and profiling can make!
Sun Feb 4, 2024🔗
Oof, I miss recursion.
In the absence of recursion I'm working on a little stack language evaluator that will evaluate the distance to surfaces using signed distance functions. I figure if it works well I could use it for both raymarching the distance and evaluating the color/material of the object.
Thu Feb 1, 2024🔗
I've contributed to rust-gpu.
Just a small little thing.
I added the ability to pass cargo features to the shader crate through spirv-builder.
Tue Jan 27, 2024🔗
Raymarching!🔗
Raymarching is totally cool and fun. I'm trying to set up an AST of SDF types but I'm really battling the compile times. I have a theory that recursive enums slow down compilation like crazy. Here's an example of my AST:
#[cfg_attr(not(target_arch = "spirv"), derive(Debug))]
#[derive(Default, Clone, Copy, SlabItem)]
pub struct Translated {
    pub shape: Id<SdfShape>,
    pub translation: Vec3,
}

#[cfg_attr(not(target_arch = "spirv"), derive(Debug))]
#[derive(Default, Clone, Copy, SlabItem)]
pub enum SdfShape {
    #[default]
    None,
    Sphere(Id<Sphere>),
    Cuboid(Id<Cuboid>),
    Line(Id<Line>),
    Bezier(Id<Bezier>),
    Path(Id<Path>),
    Translated(Id<Translated>),
}

impl SdfShape {
    pub fn distance(&self, mut position: Vec3, slab: &[u32]) -> f32 {
        let mut shape = *self;
        loop {
            match shape {
                Self::None => return 0.0,
                Self::Sphere(id) => {
                    let circle = slab.read(id);
                    return circle.distance(position);
                }
                Self::Line(id) => {
                    let line = slab.read(id);
                    return line.distance(position);
                }
                Self::Bezier(id) => {
                    let bez = slab.read(id);
                    return bez.distance(position);
                }
                Self::Cuboid(id) => {
                    let rectangle = slab.read(id);
                    return rectangle.distance(position);
                }
                Self::Path(id) => {
                    let path = slab.read(id);
                    return path.distance(position, slab);
                }
                Self::Translated(id) => {
                    let translated = slab.read(id);
                    shape = slab.read(translated.shape);
                    position -= translated.translation;
                    continue;
                }
            };
        }
    }
}
The odd loop in SdfShape::distance is to avoid recursion. rust-gpu already complained about
that. This version took 2m 01s to compile. I've seen it as high as 4m. I'm going to
rewrite the AST to be a bit trickier and see how/if that helps.
If I change to this representation:
#[cfg_attr(not(target_arch = "spirv"), derive(Debug))]
#[derive(Default, Clone, Copy, SlabItem)]
pub struct Translated {
    pub shape: Id<SdfShape>,
    pub translation: Vec3,
}

#[cfg_attr(not(target_arch = "spirv"), derive(Debug))]
#[derive(Default, Clone, Copy, SlabItem)]
#[repr(u32)]
pub enum ShapeType {
    #[default]
    None,
    Sphere,
    Cuboid,
    Line,
    Bezier,
    Path,
    Translated,
}

#[cfg_attr(not(target_arch = "spirv"), derive(Debug))]
#[derive(Default, Clone, Copy, SlabItem)]
pub struct SdfShape {
    pub shape_type: ShapeType,
    pub shape_id: u32,
}

impl SdfShape {
    pub fn from_sphere(id: Id<Sphere>) -> Self {
        Self {
            shape_type: ShapeType::Sphere,
            shape_id: id.inner(),
        }
    }

    pub fn from_cuboid(id: Id<Cuboid>) -> Self {
        Self {
            shape_type: ShapeType::Cuboid,
            shape_id: id.inner(),
        }
    }

    pub fn from_line(id: Id<Line>) -> Self {
        Self {
            shape_type: ShapeType::Line,
            shape_id: id.inner(),
        }
    }

    pub fn from_bezier(id: Id<Bezier>) -> Self {
        Self {
            shape_type: ShapeType::Bezier,
            shape_id: id.inner(),
        }
    }

    pub fn from_path(id: Id<Path>) -> Self {
        Self {
            shape_type: ShapeType::Path,
            shape_id: id.inner(),
        }
    }

    pub fn from_translated(id: Id<Translated>) -> Self {
        Self {
            shape_type: ShapeType::Translated,
            shape_id: id.inner(),
        }
    }

    pub fn distance(&self, mut position: Vec3, slab: &[u32]) -> f32 {
        let mut shape = *self;
        loop {
            match shape.shape_type {
                ShapeType::None => return 0.0,
                ShapeType::Sphere => {
                    let circle = slab.read(Id::<Sphere>::from(shape.shape_id));
                    return circle.distance(position);
                }
                ShapeType::Line => {
                    let id = Id::<Line>::from(shape.shape_id);
                    let line = slab.read(id);
                    return line.distance(position);
                }
                ShapeType::Bezier => {
                    let id = Id::<Bezier>::from(shape.shape_id);
                    let bez = slab.read(id);
                    return bez.distance(position);
                }
                ShapeType::Cuboid => {
                    let id = Id::<Cuboid>::from(shape.shape_id);
                    let rectangle = slab.read(id);
                    return rectangle.distance(position);
                }
                ShapeType::Path => {
                    let id = Id::<Path>::from(shape.shape_id);
                    let path = slab.read(id);
                    return path.distance(position, slab);
                }
                ShapeType::Translated => {
                    let id = Id::<Translated>::from(shape.shape_id);
                    let translated = slab.read(id);
                    shape = slab.read(translated.shape);
                    position -= translated.translation;
                    continue;
                }
            };
        }
    }
}
It compiles in 1m 37s. That's an improvement, but it's still too long to be productive.
...le sigh.
Compile times🔗
I'm going to have to really dig into this soon as the times are just grueling. Here's a log of them:
1m 37s1m 37s
Tue Jan 23, 2024🔗
I've been extending the use of SDFs. They are now in 3d.
Hit another weird snag last night where rust-gpu won't generate my PBR shader:
   Compiling renderling-shader v0.1.0 (/Users/schell/code/renderling/crates/renderling-shader)
error: cannot declare renderling_shader_pbr::pbr_fragment as an entry point
   --> /Users/schell/code/renderling/crates/renderling-shader-pbr/src/lib.rs:301:8
    |
301 | pub fn pbr_fragment(
    |        ^^^^^^^^^^^^
I just wish it would tell me why it can't declare the function as an entry point.
Nobody is talking in the rust-gpu discord channel so to debug this I'll have to descend
into the depths of the compiler...
...I figured it out! The problem was that I was using my PBR shader entry point function in my uber-shader entry point function. Apprently you cannot nest entry points within each other.
Fri Jan 19, 2024🔗
Last night I successfully rendered a font face using 2d SDF path objects (lines and quadratic Beziers):


I'm not sure of the performance characteristics of the path shader yet, so we'll have to see if it holds up well enough to render these paths at runtime or if they'll have to be cached as textures.
SDFs🔗
SDFs have turned out to be rather magical and a lot of fun! I think I'll be using them more often.
Crabslab🔗
I got my first pull request on crabslab yesterday from @cybersoulk (we both talk in Embark's
rust-gpu channel). Thanks for the PR!
I did notice while working on the SDF font rendering that resizing the slab between renders seemed to cause issues - I'll have to look into it and write some tests.
Sat Jan 13, 2024🔗
renderling can now render 2d signed distance fields including circles/points, lines,
bezier curves, rectangles and paths of line+bezier items.
It's my plan to next use point-in-polygon (modified to include quadratic beziers) to determine if a point lies inside or outside the path, which would allow us to properly fill the path downstream.
Ultimately I'd like to be able to convert TTF/OTF fonts to path outlines for resolution independent rendering.
Oh and Inigo Quilez is my new hero!
Useful links🔗
Mon Jan 8, 2024🔗
I added another ty var to crabslab::Offset to help with pointer math.
I've also added yet another layer of indirection around rendering.
Now the top level unit of rendering is Rendering, which is an enum of
Ids that point to different renderable things. There's an uber-vertex-shader
that tracks this and proxies to the correct sub-shader. This is in anticipation
of adding SDF rendering.
Fri Jan 5, 2024🔗
The slab implementation in this repo has been spun off into its own thing.
crabslab is now live!
Sometime around new years?🔗
I removed the bloom implementation completely. It will be reimplemented later as a physically-based bloom.
Sat Dec 23, 2023🔗
I've ported over a majority of the tests to the GLTF-on-the-slab implementation. I'm currently working on the big PBR test and having trouble with the skybox, which is rendering all black...
Debugging rabbit hole:
So is it even running?
Yes, logging shows that it's running.
Could it be it needs to be run in its own render pass?
Before I even check that, I see that the skybox's vertex shader uses the
instance_indexas theIdof the camera, and I'm passing0..1as the instance range in the draw call.So we need a way to pass the camera's
Idto the skybox.I just added it as a field on
SkyboxUsing that new field fixed that issue. Now I have an issue with bloom.
After fixing the skybox rendering it seems bloom isn't running.
Debugging rabbit hole:
So is it even running?
Yes, logging shows that it's running.
Is the result being used downstream during tonemapping?
It seems to be.
Let's check to see that there isn't something funky when configuring the graph.
Nothing I can tell there.
Maybe print out the brightness texture and make sure it's populated?
Losing steam here, especially since bloom needs to be re-done as "physically based".
Physically Based Bloom🔗
Thu Dec 21, 2023🔗
It's the solstice! My Dad's birthday, and another bug hunt in renderling.
Porting gltf_images test🔗
The test gltf_images tests our image decoding by loading a GLTF file and then
creating a new staged object that uses the image's texture.
It's currently coming out all black, and it should come out like
 .
.
I recently got rid of the distinction between "native" vertex data and GLTF vertex
data. Now there is only GLTF vertex data and the "native" Vertex meshes can be
conveniently staged (marshalled to the GPU) using a helper function that creates
a GltfPrimitive complete with GltfAccessors etc.
Debbuging rabbit hole:
Let's compare old vs new vertex shaders
It doesn't seem to be the vertices, because the staged vertices (read from the GPU) are equal to the original mesh.
The staged vertices are equal to the original CPU-side mesh, but the computed vertex values are different from legacy.
It looks like transforms on
RenderUnitsare not transforming their child primitive's geometryGot it! It was because
GltfNode'sDefaultinstance was settingscaletoVec3::ZERO.
Wed Dec 20, 2023🔗
I think I'm going to keep going with this idea of making GLTF the internal representation of the renderer.
Tue Dec 19, 2023🔗
Thoughts on GLTF🔗
GLTF on-the-slab has been a boon to this project and I'm tempted to make it the main way we do
rendering. I just want to write this down somewhere so I don't forget. Currently when loading
a GLTF file we traverse the GLTF document and store the whole thing on the GPU's slab. Then
the user has to specify which nodes (or a scene) to draw, which traverses one more time, linking
the RenderUnits to the primitives within the GLTF. I think it might be cognitively easier
to have GLTF nodes somehow be the base unit of rendering ... but I also have plans for supporting
SDFs and I'm not sure how that all fits together.
Anyway - I'll keep going with the momentum I have and think about refactoring towards this in the future.
Mon Dec 18, 2023🔗
Simple Texture GLTF Example🔗
The
simple_texturetest is rendering the texture upside-down.There are no rotation transformations in its node's hierarchy.
What does the atlas look like?
It's not the atlas, the two tests (slabbed and the previous non-slabbed) have identical atlas images.
So what about UV coords?
Comparing runs of the vertex shaders shows that the UV coords' Y components are flipped.
So, 0.0 is 1.0 and 1.0 is 0.0
So is there something doing this intentionally?
Nothing that I can easily see in the
gltf_supportmodules...It has something to do with the accessor.
I can see in the GLTF file that the accessor's byte offset is 48, but somehow in my code it comes out 12...
It was because the accessor's offset was not being taken into account.
Analytical Directional Lights🔗
I got analytical lighting working (at least for directional lights) on the stage.
The problem I was having was that the shaders use Camera.position in lighting
equations, but that was defaulting to Vec3::ZERO. Previously in the "scene"
version of the renderer (which I'm porting over to "stage") the camera's position
was set automatically when setting the projection and/or view.
I had to run both versions of the vertex AND fragement shaders to track this down. Ugh!
Fri Dec 8, 2023🔗
I've been having trouble getting the new GLTF files on-the-slab method to pass my previous tests. Mainly because of little things I had forgotten. Little bits of state that need to be updated to run the shaders. The most recent was that the size of the atlas needs to be updated on the GPU when the atlas changes.
I'm moving over tests from renderling/scene/gltf_support.rs to
renderling/stage/gltf_support.rs one at a time.
Thu Dec 7, 2023🔗
Ongoing work to get GLTF files on-the-slab working. When this work is done GLTF file imports should be lightening fast.
Wed Nov 15, 2023🔗
I resubmitted the NLNet grant proposal with expanded scope to take care of the
naga atomics issue.
Sat Nov 11, 2023🔗
NLNet Grant Progress🔗
I made a lot of progress on a grant from NLNet to work on renderling/naga. Ultimately I missed the funding deadline after expanding the scope of work a bit, but they encouraged me to apply for the December 1st 2023 round. I'll be working on that over the next few weeks and hopefully can start diving into that work in Q2 2024.
Slab🔗
I'm transitioning from using one GPU buffer for each array of items (Vertices, Entities, etc) to using one or two for the whole system, based on a bespoke slab-allocator.
Mon Sep 4, 2023🔗
I bumped rust-gpu to 0.9.
There was an issue that was preventing me from doing this earlier and I was avoiding dealing with it.
It turned out to be a pretty simple fix, though I don't actually understand why it fixed it.
See the related issue for more info.
Quite a big refactor looms overhead. I'm going to have to really think about how to represent the geometry on the GPU, as some of my earlier assumptions about nodes/entities doesn't hold. Specifically it seems obvious to me now that I'd like to draw duplicate nodes without duplicating the data, and also that nodes/entities may be the child of more than one parent.
Sat Sep 2, 2023🔗
I added WASM support! Most of the work was ensuring that the shaders validate (see below).
Fri Sep 1, 2023🔗
While adding WASM support I found that my shaders were not validating in the browser. Apparently this is because of an extra traspilation step from spv -> wgsl - because when targeting WebGPU in the browser, shaders must be written in WGSL, and naga's WGSL backend doesn't like infinities or NaNs.
Here's the related ticket. I ended up having to track down all the infinity and NaN comparisons and replace the functions that have those comparisons in their call trees. I then created a clippy lint to disallow those functions.
Fri Aug 4, 2023🔗
I tried to bump rust-gpu to 0.9 but ran into an
issue where shaders
that previously compiled no longer compile.
spirv-opt was erring because it didn't like something.
I'm working with @eddyb to figure out what the problem is.
Here's a link to the start of the
conversation.
I also fixed an issue where two versions of glam were being built - 0.22 by
spirv-std and 0.24 by renderling-shader, which was causing CI to fail.
Thur Aug 3, 2023🔗
I greatly reduced the artifacts in the prefiltered environment cube used for specular highlights.
I did this by using a simplified calc_lod and also by generating enough mipmaps.
Previously I was only making 5 mip levels but the calc_lod was often requiring 21+!
Of course the environment cubemap's face size is only 512, which leads to 9 mip
levels total - so now I'm providing 9 mips.
I also noticed that the IBL diffuse irradiance samples were not aligned! Now the normal's Y is flipped in the irradiance convolution.
Wed Aug 2, 2023🔗
When generating mipmaps I ran into a problem where sampling the original texture was always coming up [0.0, 0.0 0.0, 0.0]. It turns out that the sampler was trying to read from the mipmap at level 1, and of course it didn't exist yet as that was the one I was trying to generate. The fix was to sample a different texture - one without slots for the mipmaps, then throw away that texture.
I have to generate mipmaps to smooth out the irradiance and prefiltered cubemaps that we use for pbr shading.