Debug modes 🔍
When shading goes wrong - shadow acne, seams, surfaces lit from the wrong
direction - it helps to see the raw values the shader is working with.
renderling has two built-in debugging tools:
- Debug channels - visualize an intermediate value of the fragment shader as colors, one channel at a time.
- The debug overlay - draw the projected bounding volumes of every drawn primitive, useful when debugging culling. (Currently not rendering - see the caveat below.)
Example setup
We’ll debug the shadow mapping scene from the previous chapters:
    // We'll debug the shadow mapping scene from the previous chapters.
    use renderling::{
        camera::Camera,
        context::Context,
        geometry::Vertex,
        glam::{Mat4, UVec2, Vec3, Vec4},
        gltf::GltfDocument,
        light::{AnalyticalLight, DirectionalLight, Lux},
        primitive::Primitive,
        stage::Stage,
        types::GpuOnlyArray,
    };

    let ctx = Context::headless(512, 512).await;
    let stage: Stage = ctx
        .new_stage()
        .with_background_color(Vec4::new(0.25, 0.25, 0.25, 1.0));

    let _camera: Camera = {
        let aspect = 1.0;
        let fovy = core::f32::consts::PI / 4.0;
        let znear = 0.1;
        let zfar = 10.0;
        let projection = Mat4::perspective_rh(fovy, aspect, znear, zfar);
        let eye = Vec3::new(0.5, 0.5, 0.8);
        let target = Vec3::new(0.0, 0.3, 0.0);
        let up = Vec3::Y;
        let view = Mat4::look_at_rh(eye, target, up);

        stage
            .new_camera()
            .with_projection_and_view(projection, view)
    };

    let model: GltfDocument<GpuOnlyArray> = stage
        .load_gltf_document_from_path(workspace_dir().join("gltf/marble_bust_1k.glb"))
        .unwrap()
        .into_gpu_only();

    let y = -0.01;
    let s = 2.0;
    let floor: Primitive = stage
        .new_primitive()
        .with_vertices(
            stage.new_vertices([
                Vertex::default()
                    .with_position([s, y, s])
                    .with_normal(Vec3::Y),
                Vertex::default()
                    .with_position([s, y, -s])
                    .with_normal(Vec3::Y),
                Vertex::default()
                    .with_position([-s, y, -s])
                    .with_normal(Vec3::Y),
                Vertex::default()
                    .with_position([s, y, s])
                    .with_normal(Vec3::Y),
                Vertex::default()
                    .with_position([-s, y, -s])
                    .with_normal(Vec3::Y),
                Vertex::default()
                    .with_position([-s, y, s])
                    .with_normal(Vec3::Y),
            ]),
        )
        .with_material(
            stage
                .new_material()
                .with_albedo_factor(Vec4::new(0.85, 0.85, 0.85, 1.0)),
        );

    let sun: AnalyticalLight<DirectionalLight> = stage
        .new_directional_light()
        .with_direction(Vec3::new(-0.4, -1.0, -0.6).normalize())
        .with_color(Vec4::ONE)
        .with_intensity(Lux::OUTDOOR_OVERCAST_HIGH);

    let shadow_map = stage
        .new_shadow_map(&sun, UVec2::splat(1024), 0.1, 10.0)
        .unwrap();
    shadow_map
        .update(
            &stage,
            model.renderlets_iter().chain(std::iter::once(&floor)),
        )
        .unwrap();

    let frame = ctx.get_next_frame().unwrap();
    stage.render(&frame.view());
    let img_none = frame.read_image().await.unwrap();
    img_none.save("debug/none.png").unwrap();
    frame.present();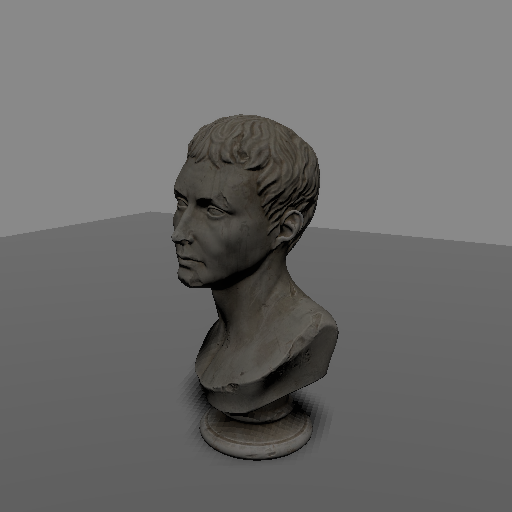
Debug channels
Set the stage’s debug channel with Stage::set_debug_mode (or
Stage::with_debug_mode at stage creation). The scene then renders through
the given DebugChannel, which early-exits the fragment shader and displays
an intermediate value as colors:
    use renderling::pbr::debug::DebugChannel;

    // Display the world-space normals, after normal mapping.
    stage.set_debug_mode(DebugChannel::Normals);

    let frame = ctx.get_next_frame().unwrap();
    stage.render(&frame.view());
    let img_normals = frame.read_image().await.unwrap();
    img_normals.save("debug/normals.png").unwrap();
    frame.present();

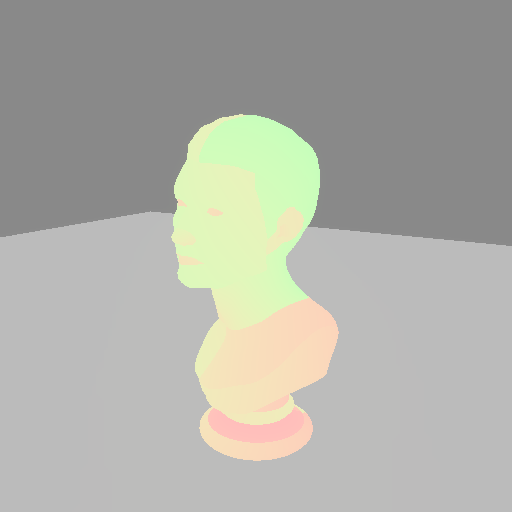
    // Display the first set of UV coordinates.
    stage.set_debug_mode(DebugChannel::UvCoords0);

    let frame = ctx.get_next_frame().unwrap();
    stage.render(&frame.view());
    let img_uv = frame.read_image().await.unwrap();
    img_uv.save("debug/uv-coords.png").unwrap();
    frame.present();

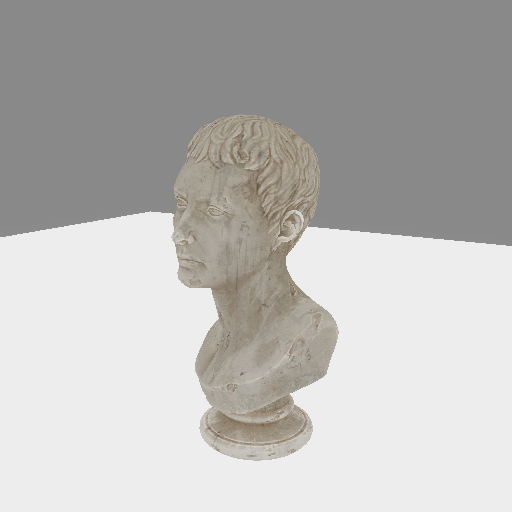
    // Display just the albedo color.
    stage.set_debug_mode(DebugChannel::Albedo);

    let frame = ctx.get_next_frame().unwrap();
    stage.render(&frame.view());
    let img_albedo = frame.read_image().await.unwrap();
    img_albedo.save("debug/albedo.png").unwrap();
    frame.present();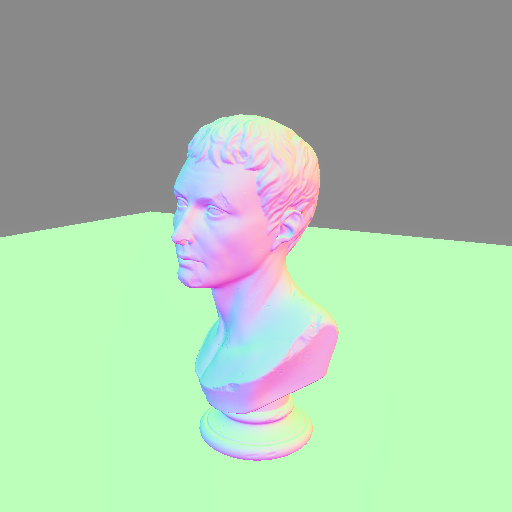
The full set of channels, grouped by what they show:
| group | channels | reach for when |
|---|---|---|
| geometry | UvCoords0, UvCoords1, VertexColor | texture mapping looks wrong, colors are off |
| normals | VertexNormals, Normals, UvNormals, Tangents, Bitangents | lighting/shadows come from the wrong direction; normal maps misbehaving |
| material | Albedo, Roughness, Metallic, Occlusion | a material parameter is not what you think it is |
| emissive | Emissive, UvEmissive, EmissiveFactor, EmissiveStrength | glowing too much or not at all |
| lighting | DiffuseIrradiance, SpecularReflection, Brdf | isolating what the lights and IBL actually contribute |
For example, Normals is the first thing to check when a shadow appears on a
surface that should be lit: a wrong normal explains most “shadows where there
shouldn’t be any” bugs, including shadow-mapping acne.
Set the channel back to DebugChannel::None to render normally again.
The debug overlay
Stage::set_use_debug_overlay (or with_debug_overlay) draws the projected
bounding volume of every drawn primitive as outlines on top of the final
image. It is meant for debugging why things draw or don’t draw - for example
when frustum culling is more aggressive than expected.
Caveat: the debug overlay currently produces no visible output, even on the GPU-driven indirect drawing path it requires - see issue #243. It also silently does nothing under direct drawing, since the overlay visualizes the indirect draw calls.